Improving Problem Solving and Focus with Fishbone Diagrams

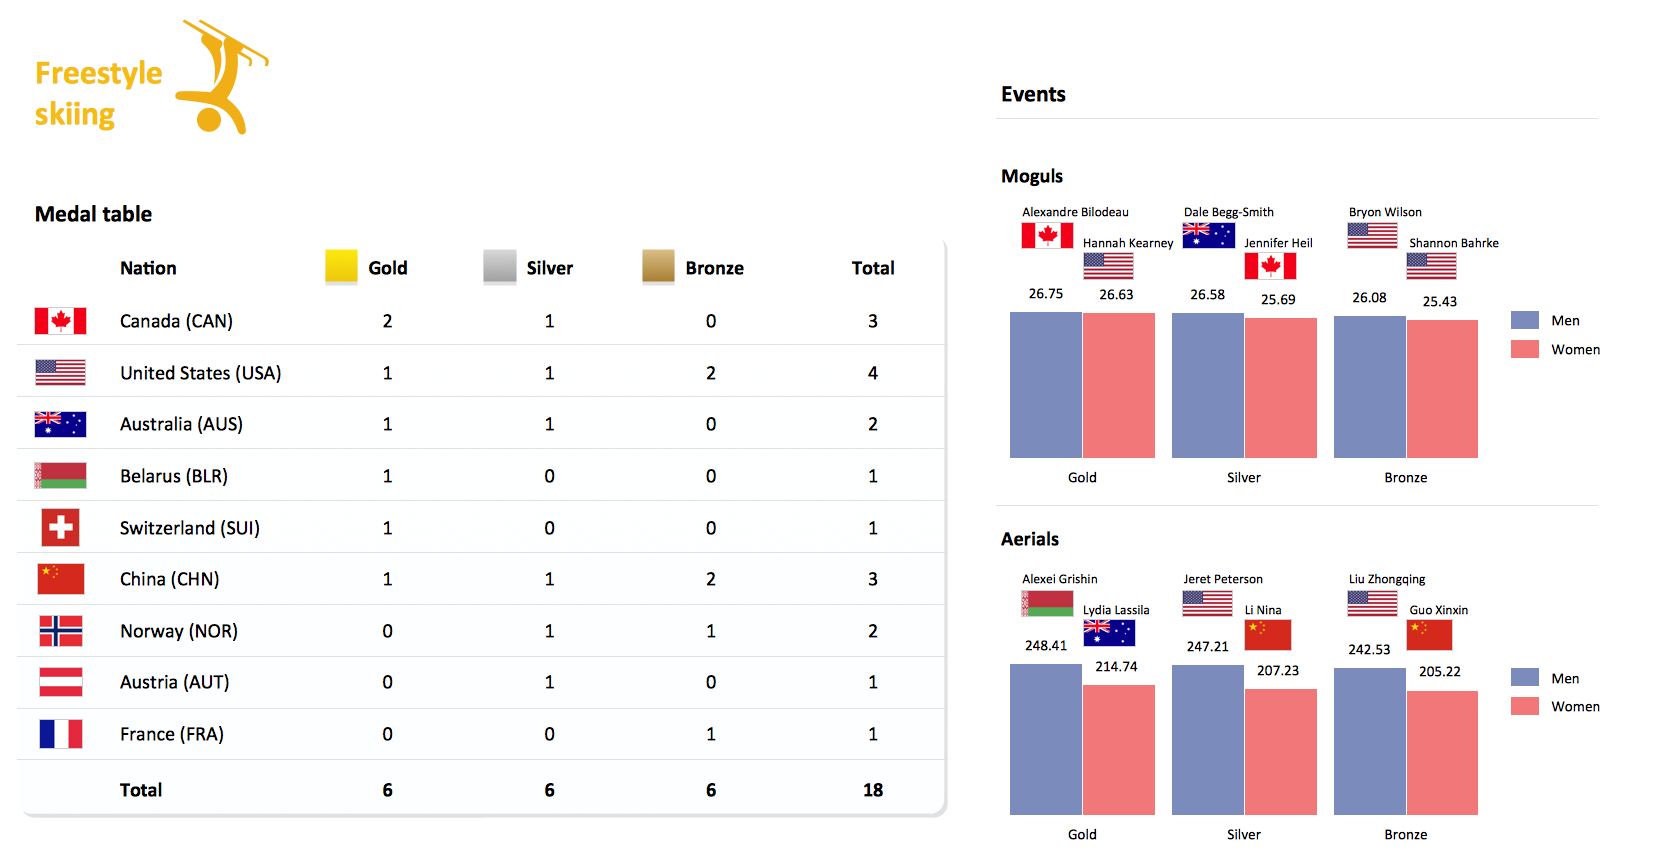
Winter Sports. Olympic Games Illustrations. Medal Summary
Fishbone Diagram Design Element
.png)
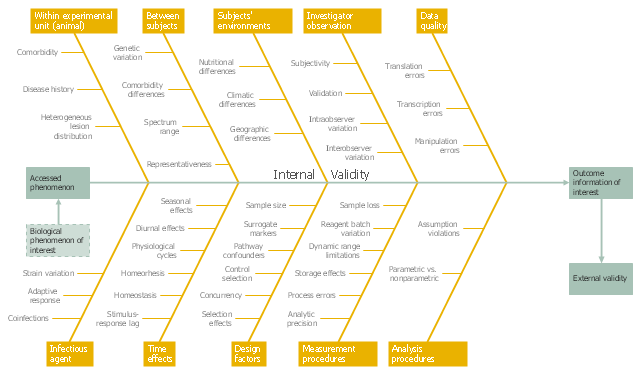
This example was created on the base of the figure from the website of the WSU College of Veterinary Medicine of the Washington State University. [vetmed.wsu.edu/ courses-jmgay/ images/ Ishikawa%20 Variance%20 Diagram.jpg]
"Internal validity is a property of scientific studies which reflects the extent to which a causal conclusion based on a study is warranted. Such warrant is constituted by the extent to which a study minimizes systematic error (or 'bias')." [Internal validity. Wikipedia]
The fishbone diagram example "Ishikawa variance diagram" was created using the ConceptDraw PRO diagramming and vector drawing software extended with the Fishbone Diagrams solution from the Management area of ConceptDraw Solution Park.
Ishikawa diagram
Ishikawa Diagram

Fishbone Problem Solving

This example was created on the base of the figure from the website of Minnesota Department of Health. [health.state.mn.us/ divs/ opi/ qi/ images/ fishbone_ ex.png]
"Minnesota’s Health Alert Network (HAN) enables public health staff, tribal governments, health care providers, emergency workers, and others working to protect the public to exchange information during a disease outbreak, environmental threat, natural disaster, or act of terrorism." [health.state.mn.us/ han/ ]
The fishbone diagram example "HAN project" was created using the ConceptDraw PRO diagramming and vector drawing software extended with the Fishbone Diagrams solution from the Management area of ConceptDraw Solution Park.
Ishikawa diagram

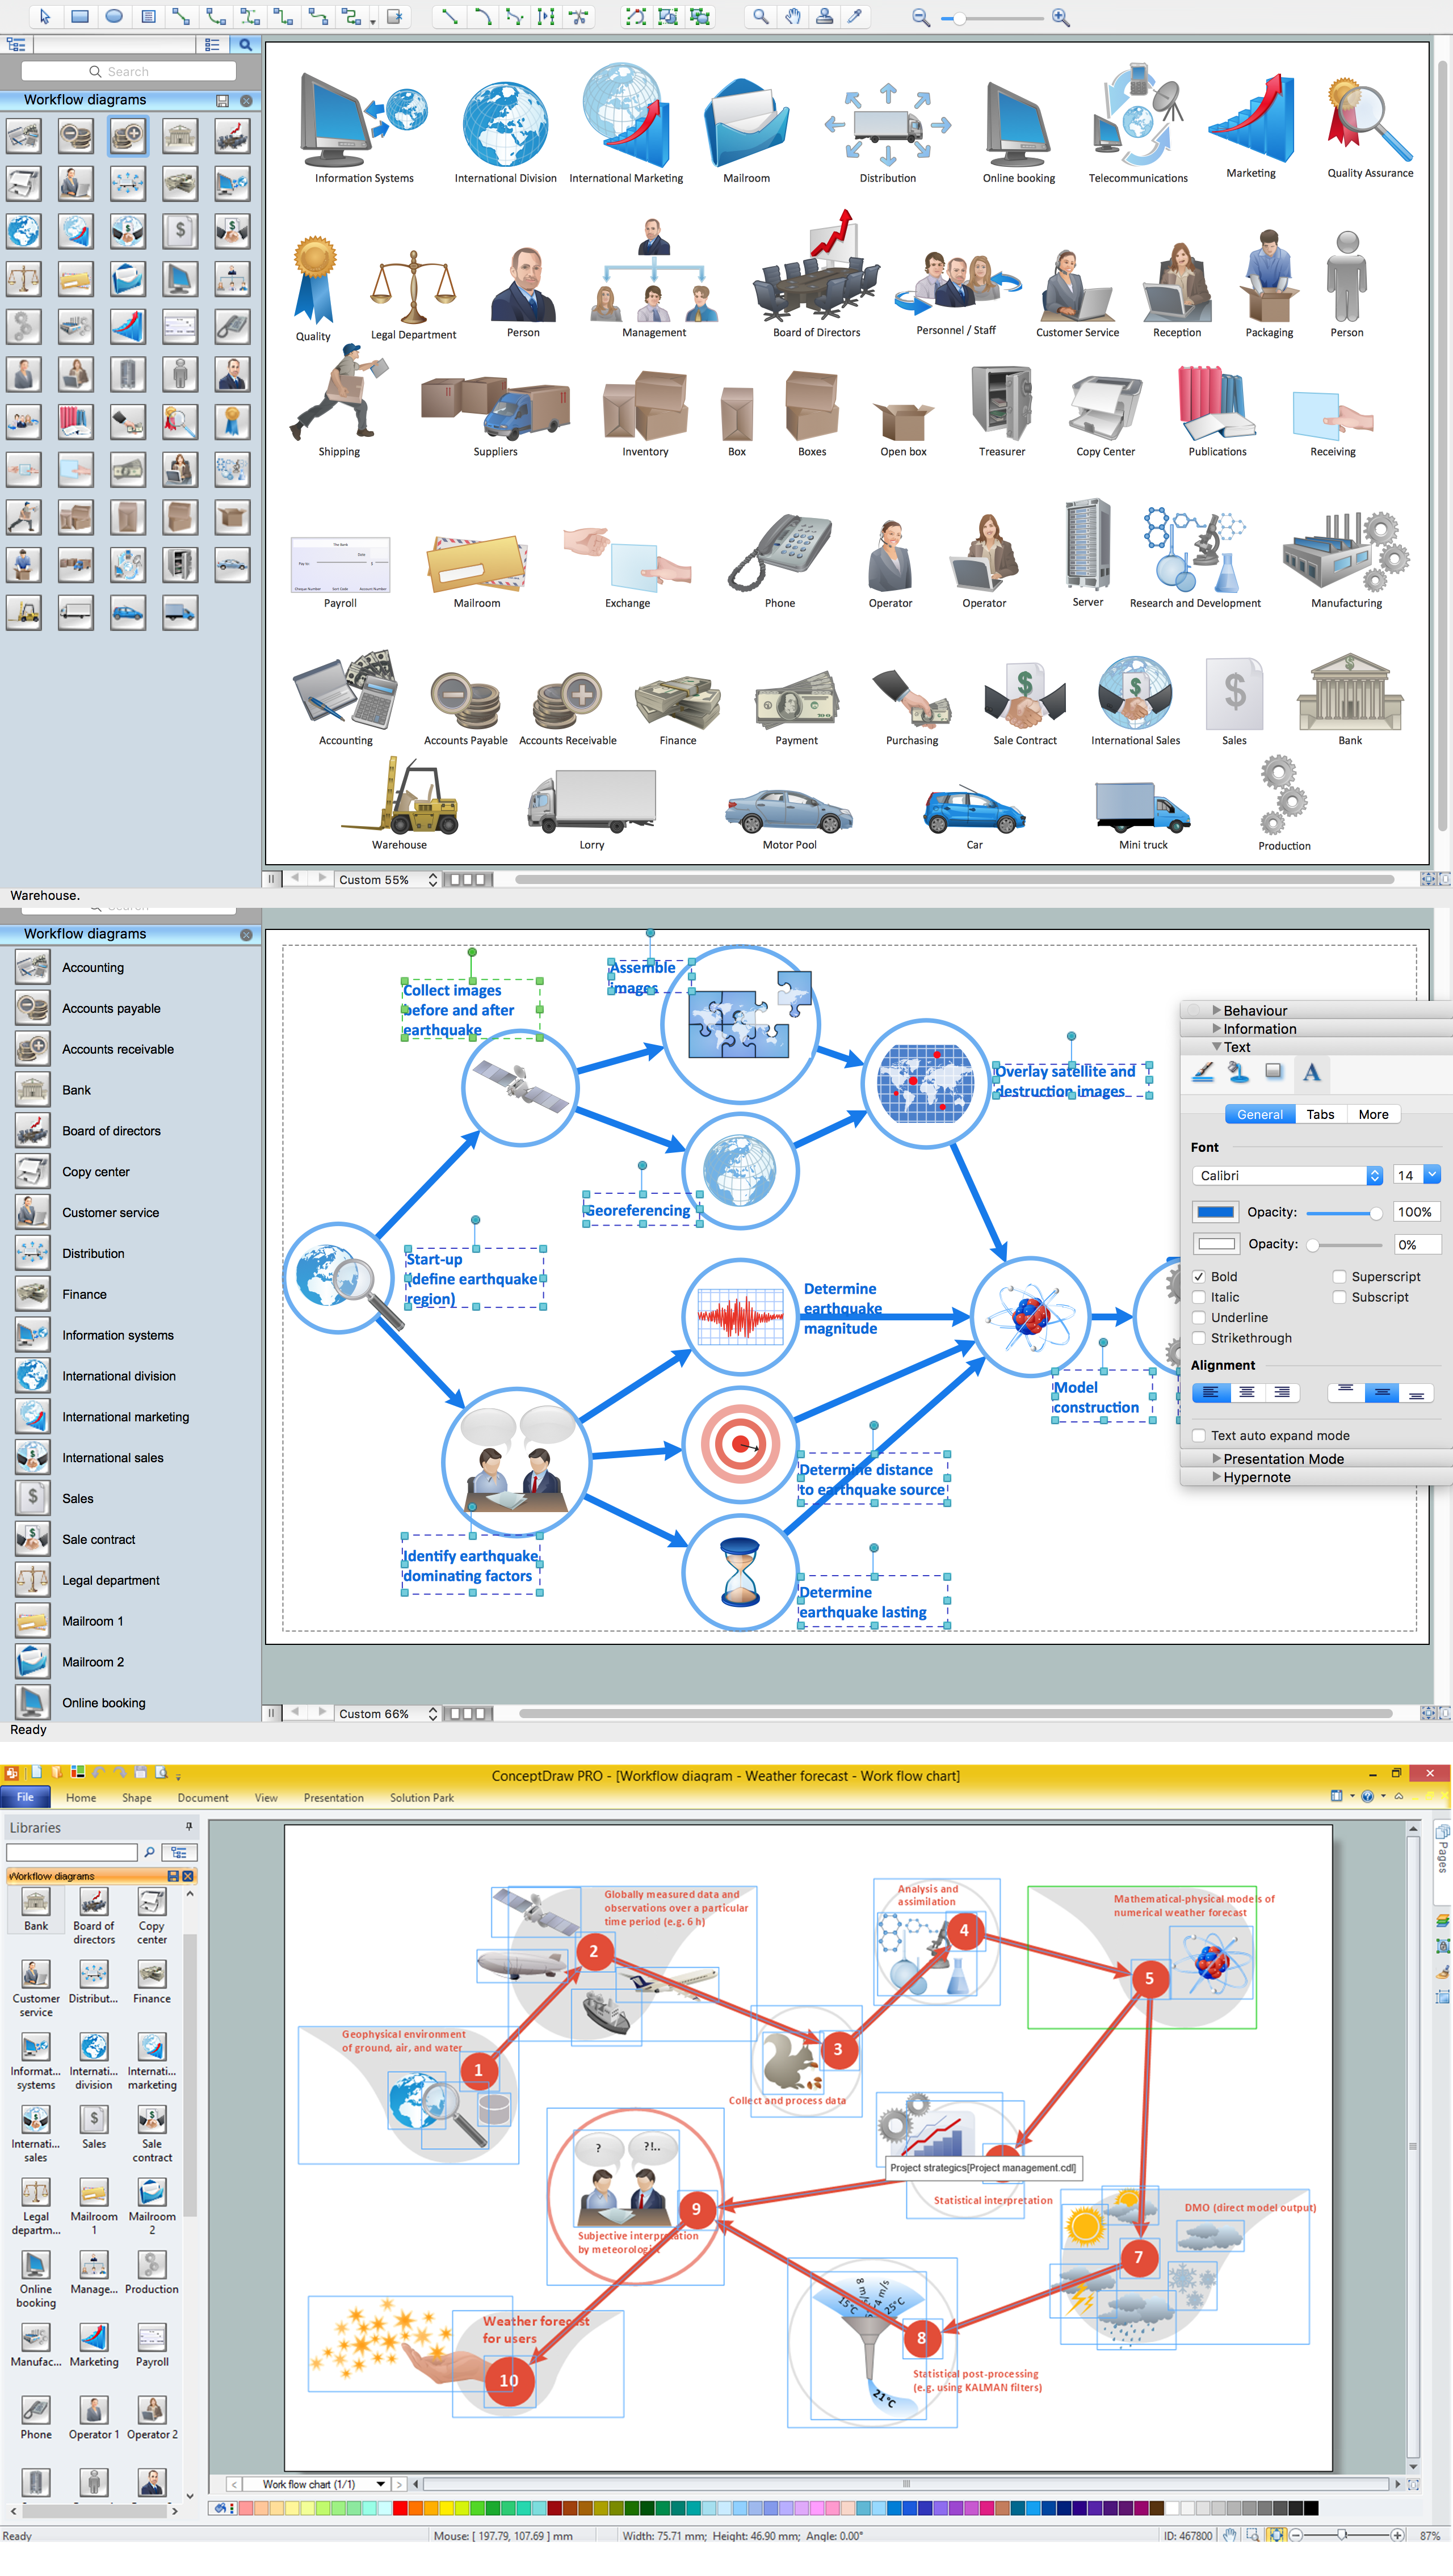
Workflow Diagram Examples
Fishbone Diagram

 Fishbone Diagrams
The Fishbone Diagrams solution extends ConceptDraw DIAGRAM software with the ability to easily draw the Fishbone Diagrams (Ishikawa Diagrams) to clearly see the cause and effect analysis and also problem solving. The vector graphic diagrams produced using this solution can be used in whitepapers, presentations, datasheets, posters, and published technical material.
- Fishbone Diagrams | Fishbone diagram - HAN project | DroidDia ...
- Fishbone Diagram | Fishbone Problem Solving | Fishbone Diagrams ...
- Hd Fishbone Images
- Picture Graphs | Process Flowchart | Fishbone Diagram | Graph ...
- Ishikawa variance diagram | Fishbone Diagrams | Personal area ...
- Fishbone Pictures
- Fishbone diagram - HAN project | Causes And Effects Of Terrorism
- Fishbone Diagrams | Fishbone Diagram Problem Solving ...
- How to Add a Fishbone Diagram to a PowerPoint Presentation ...
- Fishbone Diagrams | Fishbone Diagram | Food Court | Fishbone ...