This site uses cookies. By continuing to browse the ConceptDraw site you are agreeing to our Use of Site Cookies.
HelpDesk

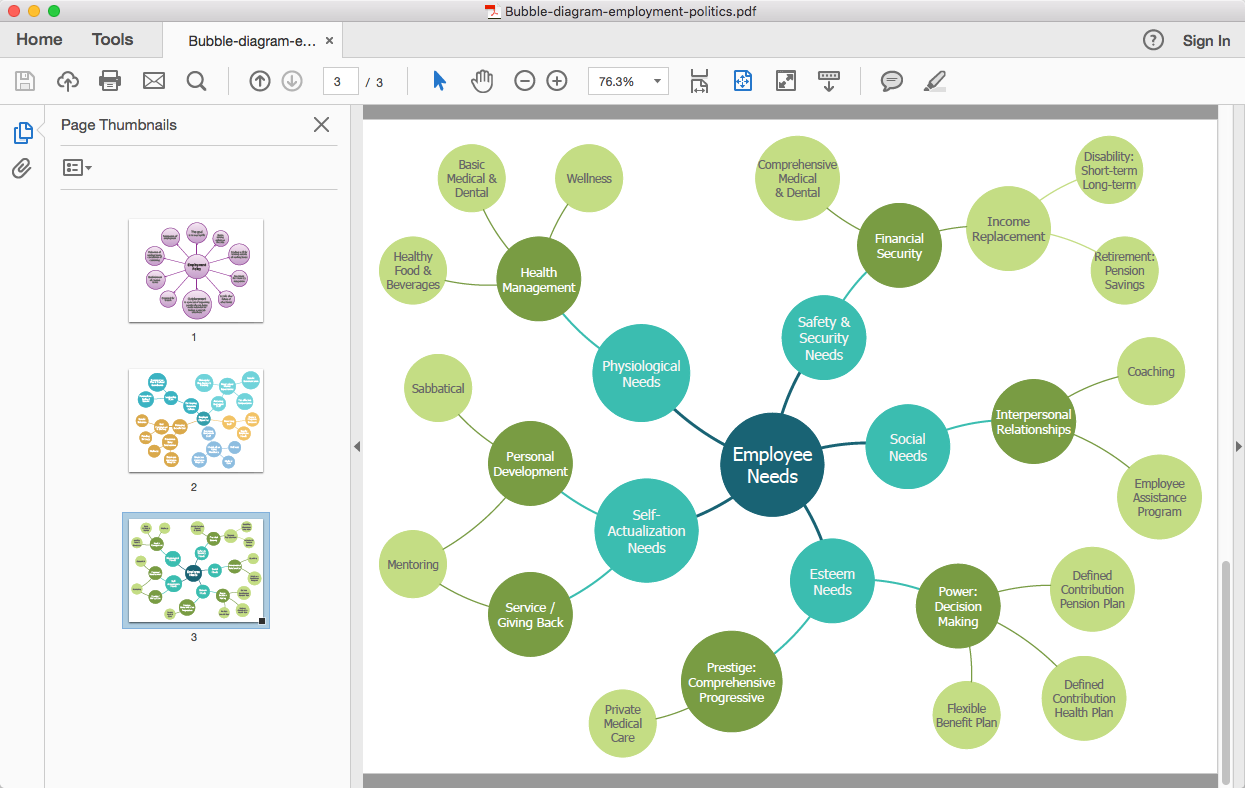
How to Create a Bubble Diagram

Bubble Diagram is a simple chart that consists of circles (bubbles) repesening certain topics or processes. Bubbles are connected by lines depicting the type of relationships between the bubbles. The size of each bubble is depended on the importance of the entity it represents. Bubble charts are widely used throughout social, economical, medical, and other scientific researches as well as throughout architecture and business management. Bubble charts are often used during the early stages of product development to visualize thoughts and ideas for the purpose of sketching out a development plan. ConceptDraw DIAGRAM allows you to draw a bubble diagrams using the Bubble Diagrams solution.

Bar Diagrams for Problem Solving. Create event management bar charts with Bar Graphs Solution

Create bar charts for event management problem solving and visual data comparison using the ConceptDraw DIAGRAM diagramming and vector drawing software extended with the Bar Graphs Solution from the Graphs and Charts area of ConceptDraw Solition Park.
HelpDesk

How to Add a Bubble Diagram to MS Word

A bubble diagram is used the same purpose as a scatter diagram, but in the case, if the data has three dimensions, each of that containing the set of values. A bubble chart is a diagram in which the data points are replaced with bubbles, and the size of the bubbles represents some additional dimension of the data. A bubble chart does not have the axis. The sizes of the bubbles are determined by the values in the third dimension. Any additional information about the entities beyond their three primary dimensions can be depicted by rendering bubbles in colors and patterns that are selected in a certain way. The legend containing the further information can be added to a bubble diagram. ConceptDraw DIAGRAM allows you to easily create various business management and marketing charts, including bubble diagrams and then add them to an MS Word document.
HelpDesk

How To Create Visio Bubble Chart

ConceptDraw DIAGRAM allows you to easily create business charts and diagrams of any complexity, including the bubbles diagram and then make an MS Visio file from your diagram in a few simple steps.
HelpDesk

How To Convert a Bubble Diagram to Adobe PDF

ConceptDraw DIAGRAM allows you to easily share your business documentation between different computers with different operating systems and applications using its export capabilities. You can get your bubble diagrams in pdf format and freely communicate them with others.
HelpDesk

How to Add a Bubble Diagram to PowerPoint Presentation

Bubble diagrams can be used to compare concepts and identify areas of similarity and difference. ConceptDraw DIAGRAM allows you to make an MS PowerPoint Presentation from your charts in a few simple steps. A bubble diagram is a chart that represents information visually in the form of a series of bubbles. Bubble charts are often used in marketing and management during the early stages of product development to visualize ideas and concepts by organizing them in a hierarchy. The ability to create this form of a diagram is contained within the Bubble Diagrams solution. A PowerPoint presentation of bubble diagrams can be used to demonstrate and identify areas of similarity and difference of featured business ideas and concepts.

business processes, business management, plan projects Business Package for Management

business processes, business management, plan projects
Package intended for professional who designing and documenting business processes, preparing business reports, plan projects and manage projects, manage organizational changes, prepare operational instructions, supervising specific department of an organization, workout customer service processes and prepare trainings for customer service personal, carry out a variety of duties to organize business workflow.

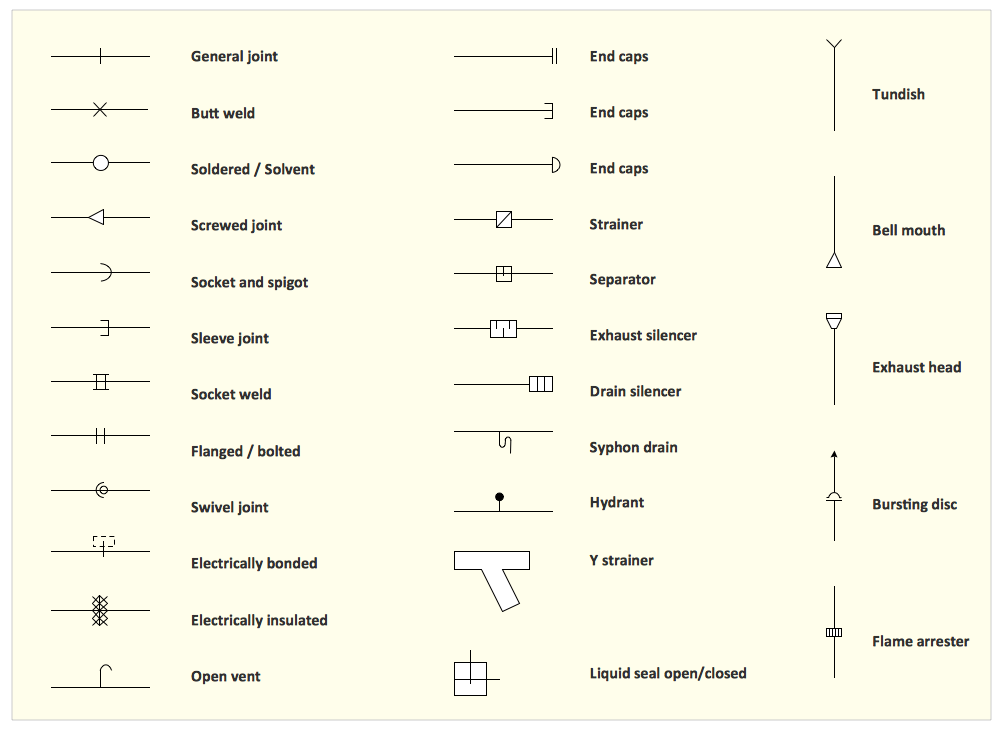
Interior Design. Piping Plan — Design Elements

Every apartment needs renovation from time to time, as some home systems such as wiring or plumbing may fall out. When developing the future design of a piping system, the engineer should take into account many aspects. Replacing the worn plumbing begins with the choice of materials and sizes of pipes for the new system. Each proposal has its own pros and cons that should be considered before purchasing. It is also relevant to draw attention to temperature changes that might effect pipes, such as freezing or thermal expansion. Let’s take a closer look at possible pipes materials.

ducation infographics and infograms, Business intelligence dashboards, Business intelligence charts and maps, Bubble diagrams and charts, Spray diagrams, Circle-Spoke diagrams and models, Circle diagrams, Circular arrows diagrams, Circular flow diagrams, Education Package

ducation infographics and infograms, Business intelligence dashboards, Business intelligence charts and maps, Bubble diagrams and charts, Spray diagrams, Circle-Spoke diagrams and models, Circle diagrams, Circular arrows diagrams, Circular flow diagrams,
Education Package is a comprehensive set of multifarious graphical solutions from ConceptDraw Solution Park, collected together in help to ConceptDraw DIAGRAM users working in a field of science, education and training, which is aimed at improving the quality of education and helping to design with ease variety of interesting and colorful educational materials, diagrams, charts and maps. Use it to present the information and knowledge in an interesting, clear, structured and simple form to achieve a success in education and pedagogy, to maintain the interest of students and pupils throughout the whole learning process, at the lectures, lessons and even during independent work with additional materials, to contribute to better perception of scientific information by listeners during the conferences and reports.

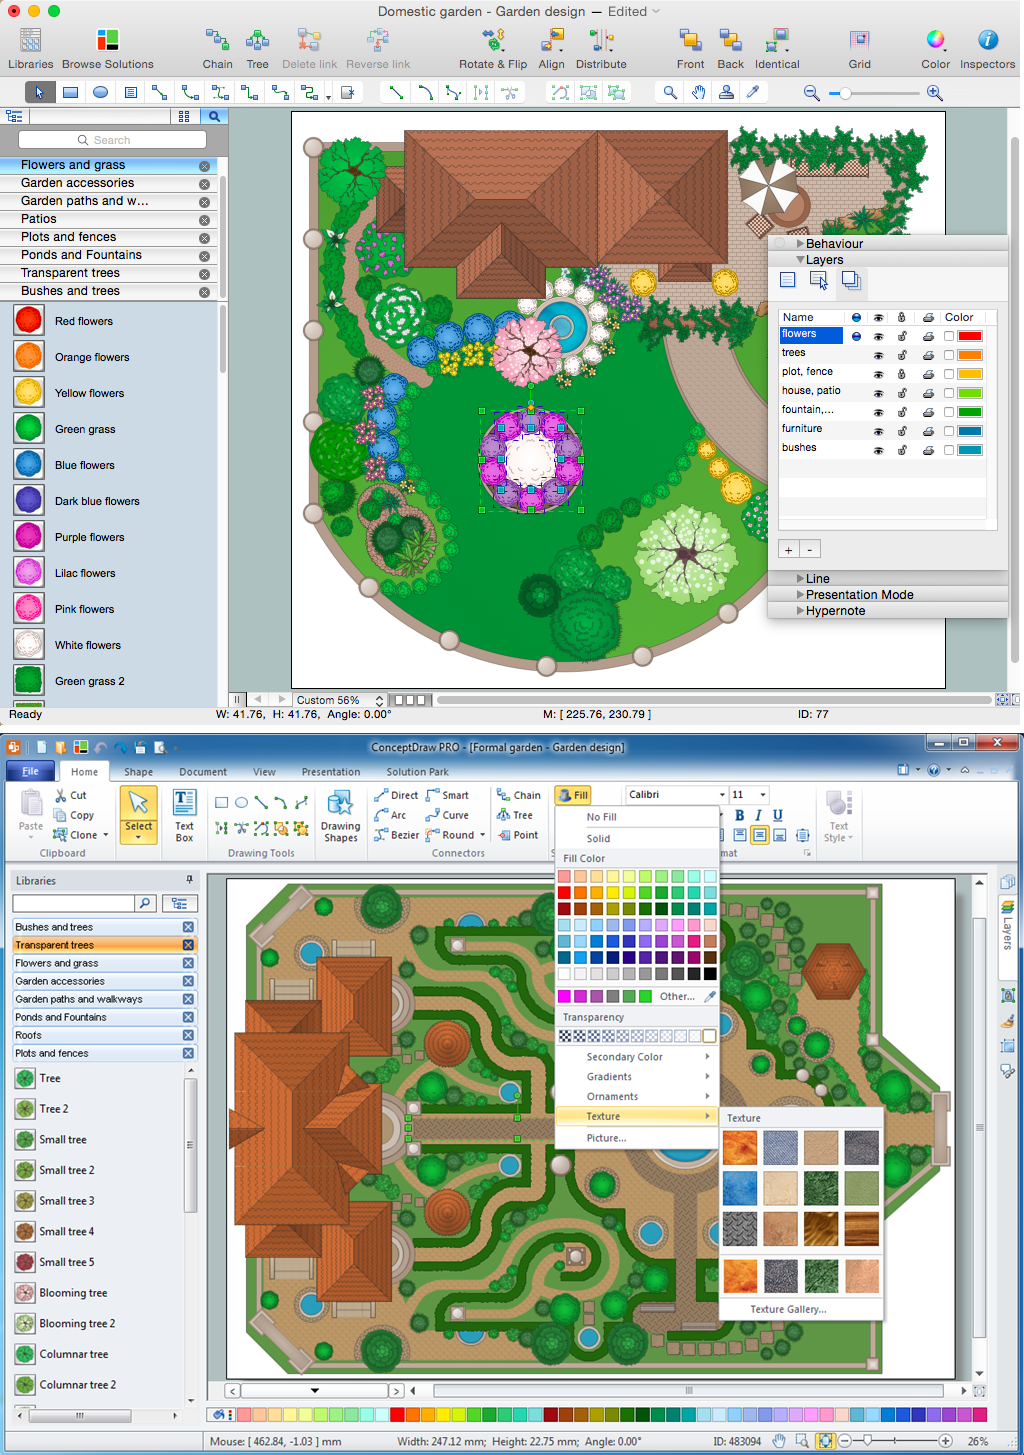
Landscape Architecture with ConceptDraw DIAGRAM

As the landscape created using ConceptDraw is not a static document, it can be used not only in the work of landscape architects and engineers, but also by landscape managers who maintain artificial landscapes such as parks and gardens, or natural landscapes like woodlands or nature reserves.
The Landscape and Garden solution contains 14 libraries containing 420 vector graphics shapes, is suitable for any green-fingered gardener wondering how to design a garden.