This site uses cookies. By continuing to browse the ConceptDraw site you are agreeing to our Use of Site Cookies.

Venn Diagram Template for Word

This template shows the Venn Diagram. It was created in ConceptDraw DIAGRAM diagramming and vector drawing software using the ready-to-use objects from the Venn Diagrams Solution from the "Diagrams" area of ConceptDraw Solution Park.
HelpDesk

How to Create a Venn Diagram

Venn diagrams were invented by John Venn as a method of depicting relationships between different components. A Venn diagram consists of two or more circles. Each circle represents a specific group or set. The entities which are depicted by circles generally have some common characteristics. A Venn Diagram shows all the possible logical relations between these entities. Any properties that belong to more than one set should be indicated in the sections where the circles overlap. A Venn Diagram can be useful to visually summarize the status and future viability of a project. ConceptDraw DIAGRAM allows you to make Venn diagrams using the Venn Diagrams solution.

Venn Diagram

Venn diagrams are illustrations used in the branch of mathematics known as set theory. They show the mathematical or logical relationship between different groups of things (sets). A Venn diagram shows all the possible logical relations between the sets.

Venn Diagram Examples for Problem Solving. Venn Diagram as a Truth Table

Venn diagrams are illustrations used in the branch of mathematics known as set theory. They show the mathematical or logical relationship between different groups of things (sets). A Venn diagram shows all the possible logical relations between the sets.

Basic Circles Venn Diagram. Venn Diagram Example

Venn Diagrams visualize all possible logical relations between several sets and are widely used in mathematics, logic, statistics, marketing, sociology, etc.
This Venn Diagram shows the relative complement of the set A with respect to the set B. It is the set of the elements in B, but not in A. In other words it is the set-theoretic difference B-A.
HelpDesk

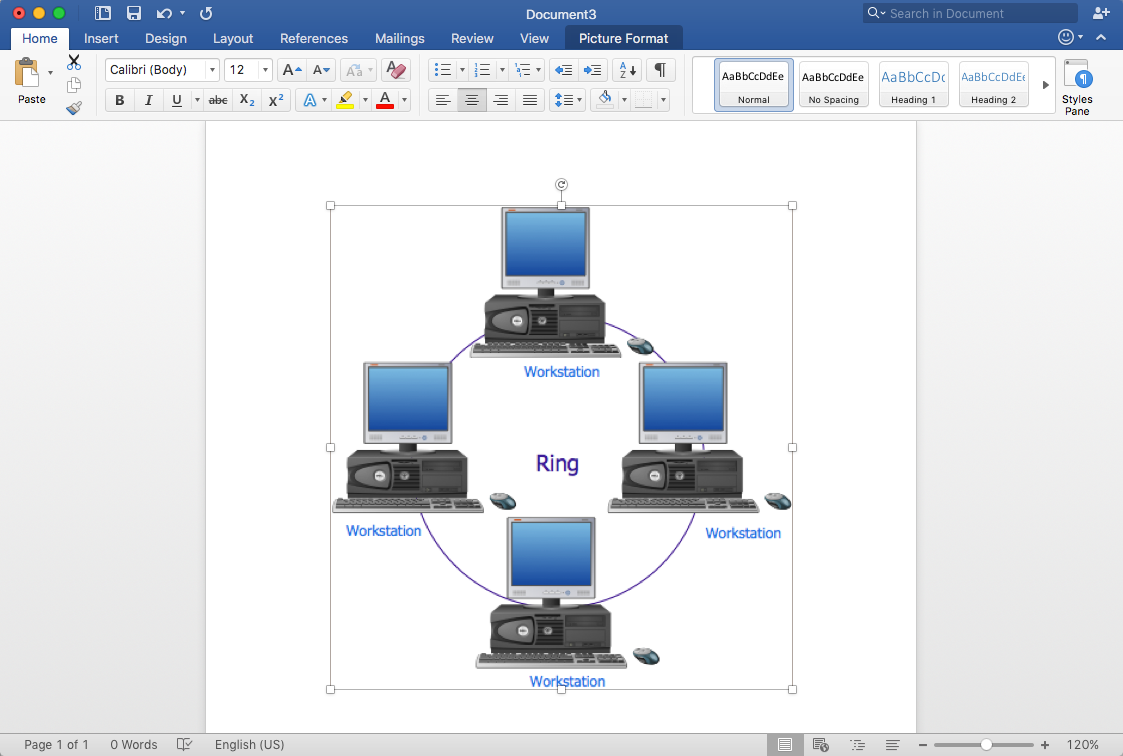
How to Add a Network Diagram to MS Word

Effective management of the computer network of any size includes the creation and maintenance of the network documentation package. Computer network diagrams may be the part of the network documentation that is often presented as MS Word document. Network diagrams describing the topology of the network and equipment installed in the network, are the essential part of this package. ConceptDraw DIAGRAM provides network administrators with the ability to easily create computer network diagrams and then insert them into an MS Word document.

Venn diagram, draw logical relations Venn Diagrams

Venn diagram, draw logical relations
Venn Diagrams are actively used to illustrate simple set relationships in set theory and probability theory, logic and statistics, mathematics and computer science, linguistics, sociology, and marketing. Venn Diagrams are also often used to visually summarize the status and future viability of a project.

venn, venn diagram Basic Venn Diagrams

venn, venn diagram
This solution extends ConceptDraw DIAGRAM (or later) with samples, templates, and libraries of vector stencils for drawing Venn Diagrams.

Cylinder Venn Diagram

You need design Cylinder Venn Diagram? Nothing could be easier with ConceptDraw DIAGRAM diagramming and vector drawing software extended with Venn Diagrams Solution from the “Diagrams” Area. ConceptDraw DIAGRAM allows you to design various Venn Diagrams including Cylinder Venn Diagrams.

Multi Layer Venn Diagram. Venn Diagram Example

To visualize the relationships between subsets of the universal set you can use Venn diagrams. To construct one, you should divide the plane into a number of cells using n figures. Each figure in the chart represents a single set of, and n is the number of represented sets. Splitting is done in a way that there is one and only one cell for any set of these figures, the points of which belong to all the figures from the set and do not belong to others. The plane on which the figures are represented, is the universal set U. Thus, the point which does not belong to any of the figures, belongs only to U.