Data Flow Diagrams (DFD) visualize data flows in information systems.
They show: what kinds of data input to and output from the system; where the data come from and go to; where the data is stored.
DFDs are used for design and analysis of business and engineering information systems.
They are also used for data processing visualization.
They show: what kinds of data input to and output from the system; where the data come from and go to; where the data is stored.
DFDs are used for design and analysis of business and engineering information systems.
They are also used for data processing visualization.
DFD template
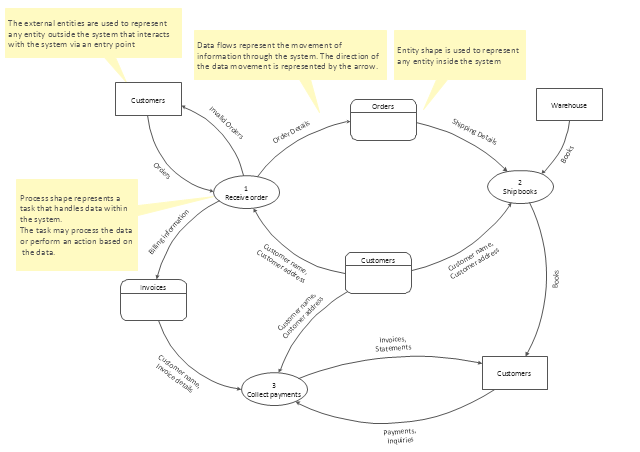
"A data flow diagram (DFD) is a graphical representation of the "flow" of data through an information system. It differs from the flowchart as it shows the data flow instead of the control flow of the program. A data flow diagram can also be used for the visualization of data processing (structured design). Data flow diagrams were invented by Larry Constantine, the original developer of structured design, based on Martin and Estrin's "data flow graph" model of computation.
It is common practice to draw a context-level Data flow diagram first which shows the interaction between the system and outside entities. The DFD is designed to show how a system is divided into smaller portions and to highlight the flow of data between those parts. This context-level Data flow diagram is then "exploded" to show more detail of the system being modeled" [Data model. Wikipedia]
The DFD (Yourdon and Coad notation) example "Model of small traditional production enterprise" was created using the ConceptDraw PRO diagramming and vector drawing software extended with the Data Flow Diagrams solution from the Software Development area of ConceptDraw Solution Park.
Data Flow Diagram Model

Control and Information Architecture Diagrams (CIAD) with ConceptDraw DIAGRAM

Software development with ConceptDraw DIAGRAM

Software development with ConceptDraw products

Create Block Diagram

- How to Create Flowcharts for an Accounting Information System ...
- How to Create Flowcharts for an Accounting Information System ...
- How to Create Flowcharts for an Accounting Information System ...
- Data Flow Diagrams
- How to Create Flowcharts for an Accounting Information System ...
- How to Create Flowcharts for an Accounting Information System ...
- How to Create Flowcharts for an Accounting Information System ...
- Data flow diagram template | Data Flow Diagrams | Process Flowchart
- Why flowchart is important to accounting information system ...
- Why flowchart is important to accounting information system ?
- How to Create Flowcharts for an Accounting Information System ...
- Data Flow Diagram
- How to Create Flowcharts for an Accounting Information System ...
- How to Create a Social Media DFD Flowchart | What is Interactive ...
- How to Create Flowcharts for an Accounting Information System ...
- Data Flow Diagram Process | DFD - Process of account receivable ...
- How to Create Flowcharts for an Accounting Information System ...
- Data Flow Diagrams with ConceptDraw PRO | Data Flow Diagram
- Why flowchart is important to accounting information system ? | Why ...
- Data structure diagram with ConceptDraw PRO | Structured Systems ...