"Credits and deposits.
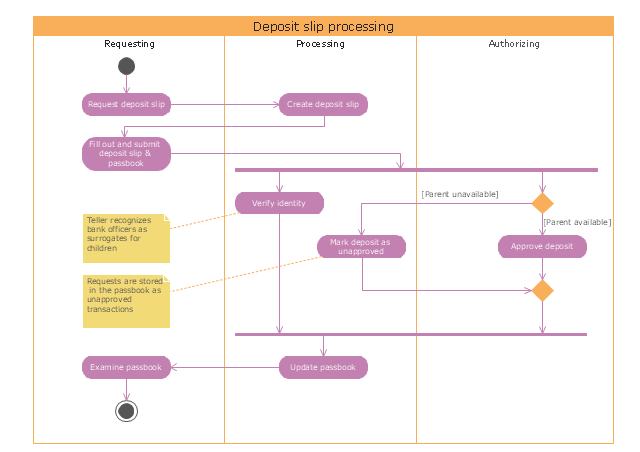
To add credit to an account by bringing cash to a bank in person, the account holder can fill a small credit slip or deposit slip. The total amount of each note and coin is counted and entered on the slip, along with who it is paid in by and the date. The cash and details are counted and checked by the teller at the bank, if everything is in order the deposit is credited to the account, the credit slip is then kept by the bank and the credit slip booklet is stamped with the date and then returned to the account holder.An account holder uses their passbook to record their history of transactions with their bank." [Passbook. Wikipedia]
The UML activity diagram example "Deposit slip processing" was created using the ConceptDraw PRO diagramming and vector drawing software extended with the Rapid UML solution from the Software Development area of ConceptDraw Solution Park.
UML activity diagram
This vector stencils library contains 47 SysML symbols.
Use it to design your state machine diagrams using ConceptDraw PRO diagramming and vector drawing software.
"The state diagram in the Unified Modeling Language is essentially a Harel statechart with standardized notation, which can describe many systems, from computer programs to business processes. In UML 2 the name has been changed to State Machine Diagram. The following are the basic notational elements that can be used to make up a diagram:
- Filled circle, representing to the initial state
- Hollow circle containing a smaller filled circle, indicating the final state (if any)
- Rounded rectangle, denoting a state. Top of the rectangle contains a name of the state. Can contain a horizontal line in the middle, below which the activities that are done in that state are indicated
- Arrow, denoting transition. The name of the event (if any) causing this transition labels the arrow body. A guard expression may be added before a "/ " and enclosed in square-brackets ( eventName[guardExpression] ), denoting that this expression must be true for the transition to take place. If an action is performed during this transition, it is added to the label following a "/ " ( eventName[guardExpression]/ action ).
- Thick horizontal line with either x>1 lines entering and 1 line leaving or 1 line entering and x>1 lines leaving. These denote join/ fork, respectively." [State diagram (UML). Wikipedia]
The vector stencils library "State machine diagram" is included in the SysML solution from the Software Development area of ConceptDraw Solution Park.
Use it to design your state machine diagrams using ConceptDraw PRO diagramming and vector drawing software.
"The state diagram in the Unified Modeling Language is essentially a Harel statechart with standardized notation, which can describe many systems, from computer programs to business processes. In UML 2 the name has been changed to State Machine Diagram. The following are the basic notational elements that can be used to make up a diagram:
- Filled circle, representing to the initial state
- Hollow circle containing a smaller filled circle, indicating the final state (if any)
- Rounded rectangle, denoting a state. Top of the rectangle contains a name of the state. Can contain a horizontal line in the middle, below which the activities that are done in that state are indicated
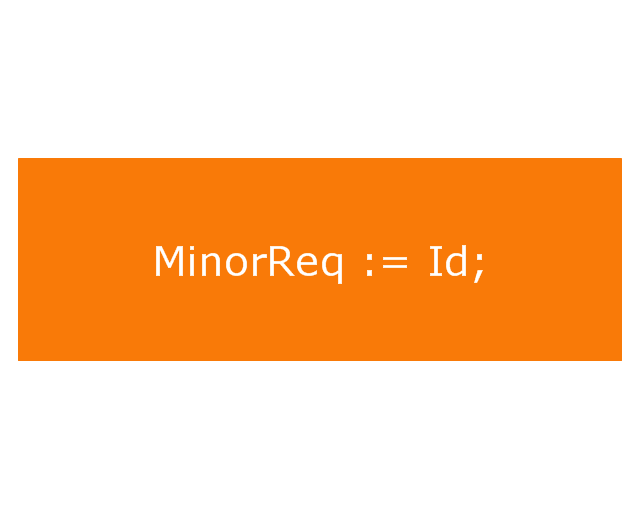
- Arrow, denoting transition. The name of the event (if any) causing this transition labels the arrow body. A guard expression may be added before a "/ " and enclosed in square-brackets ( eventName[guardExpression] ), denoting that this expression must be true for the transition to take place. If an action is performed during this transition, it is added to the label following a "/ " ( eventName[guardExpression]/ action ).
- Thick horizontal line with either x>1 lines entering and 1 line leaving or 1 line entering and x>1 lines leaving. These denote join/ fork, respectively." [State diagram (UML). Wikipedia]
The vector stencils library "State machine diagram" is included in the SysML solution from the Software Development area of ConceptDraw Solution Park.
Choice pseudostate

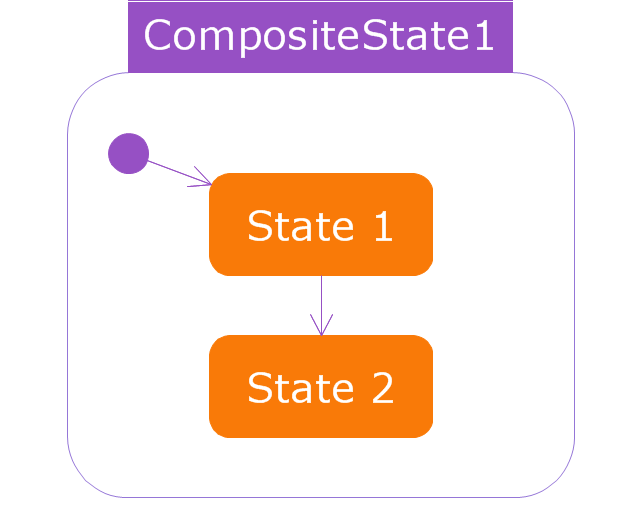
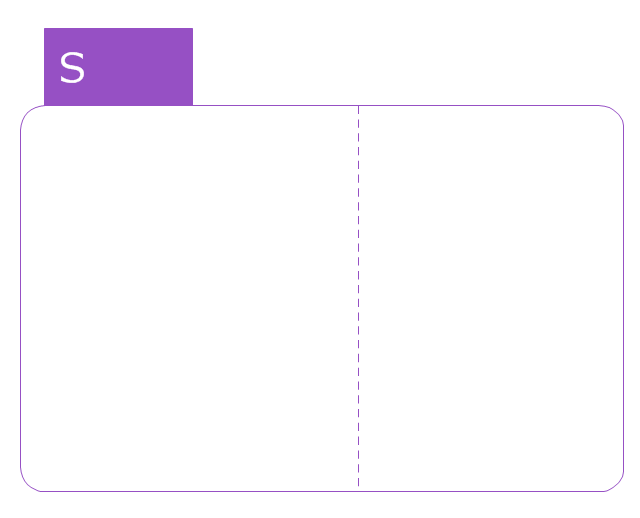
Composite state
Entry point
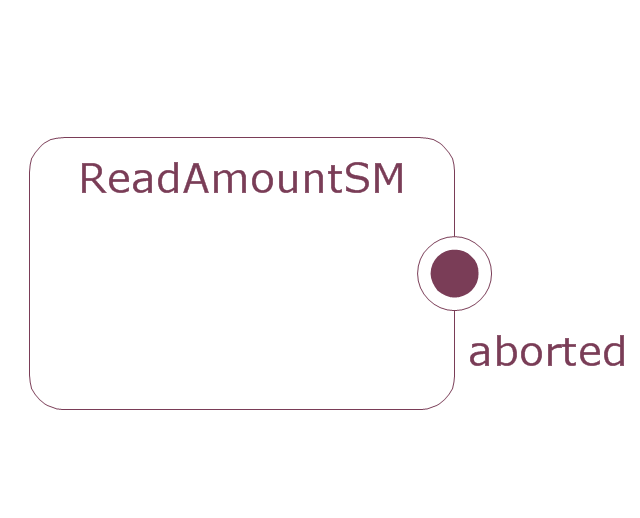
Exit point
Final state

History, deep pseudostate
History, shallow pseudostate
Initial pseudostate

Junction pseudostate

Receive signal action
Send signal action
Action
Region
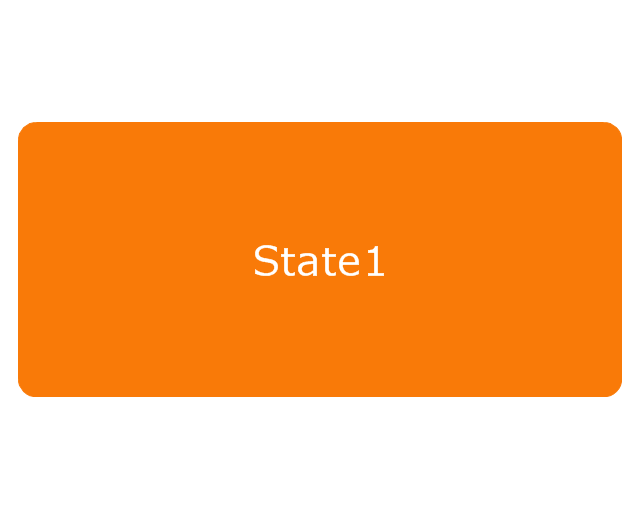
Simple state
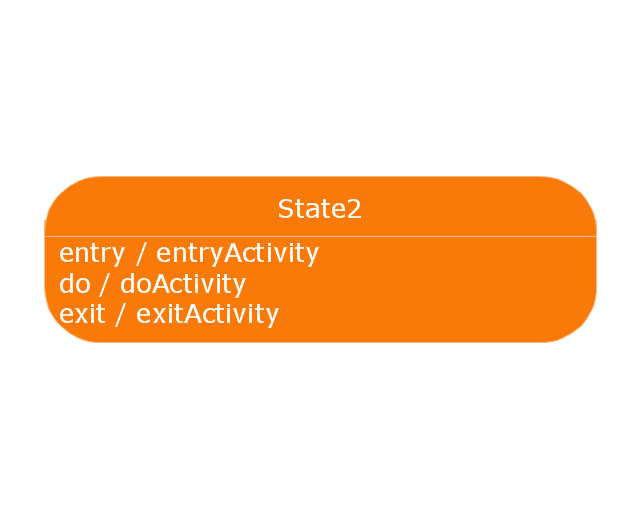
Simple state 2
State list

State machine
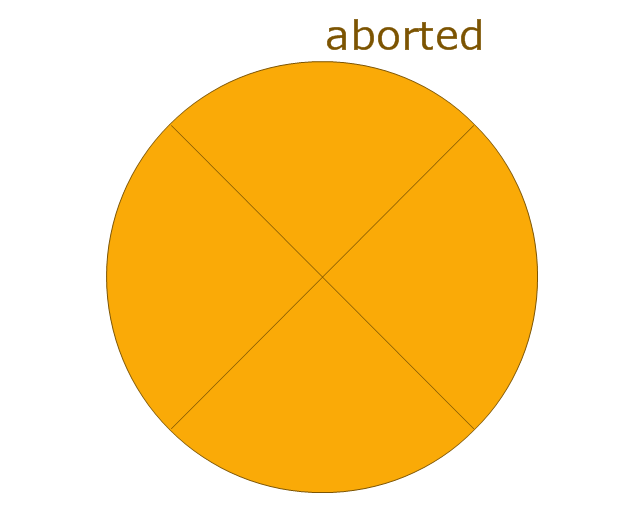
Terminate node

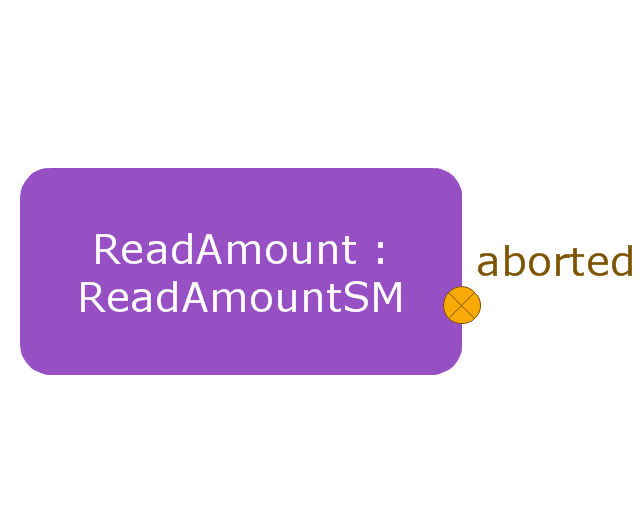
Submachine state
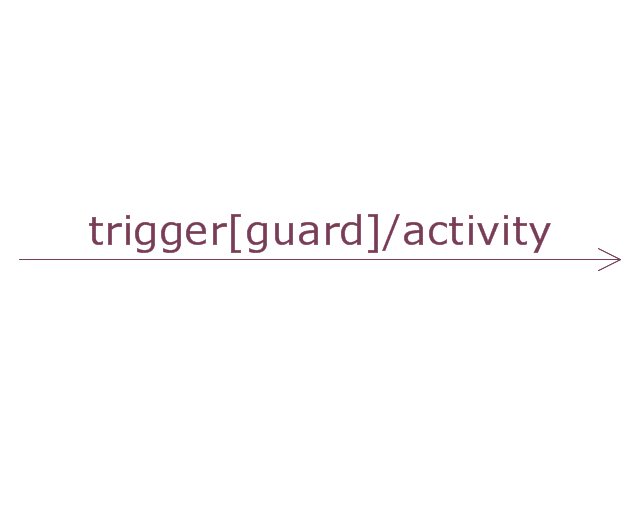
Transition
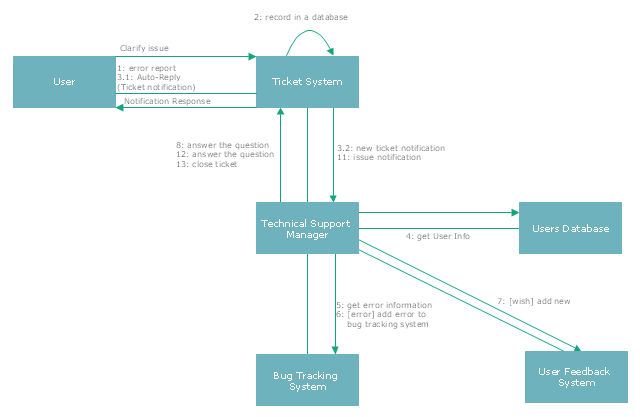
"The most common issue tracking system's design is relatively simple. A database is the main storage repository for all data. The data is managed by the business logic layer of the application. This layer gives the underlying raw data more structure and meaning, preparing it for human consumption. The now human readable data are then presented to the support technician by another software application or web page. The end-user of the issue tracking system can create entirely new issues, read existing issues, add details to existing issues, or resolve an issue. When a user of the system makes a change, the issue tracking system will record the action and who made it, so as to maintain a history of the actions taken. Each user of the system may have issues assigned to them, that is, that user is responsible for the proper resolution of that issue. This is generally presented to the user in a list format. The user may have the option of re-assigning an issue to another user, if needed. For security, an issue tracking system will authenticate its users before allowing access to the systems." [Issue tracking system. Wikipedia]
The UML communication diagram example "Ticket processing system" was created using the ConceptDraw PRO diagramming and vector drawing software extended with the Rapid UML solution from the Software Development area of ConceptDraw Solution Park.
The UML communication diagram example "Ticket processing system" was created using the ConceptDraw PRO diagramming and vector drawing software extended with the Rapid UML solution from the Software Development area of ConceptDraw Solution Park.
UML communication diagram
What is Gantt Chart (historical reference)

 Entity-Relationship Diagram (ERD)
Entity-Relationship Diagram (ERD) solution extends ConceptDraw PRO software with templates, samples and libraries of vector stencils from drawing the ER-diagrams by Chen's and crow’s foot notations.
 Audio, Video, Media
Use it to make professional-looking documents, impressive presentations, and efficient websites with colorful and vivid illustrations and schematics of digital audio, video and photo gadgets and devices, audio video connections and configurations, S Video connection, HD and 3D television systems, home entertainment systems, Closed-circuit television (CCTV) surveillance systems. All audio video schematics, drawings and illustrations designed in ConceptDraw PRO are professional looking, clear and understandable for all thanks to applying the most commonly used standards of designations, and are effective for demonstrating in front of a small audience and on the big screens.
 Metro Map
Metro Map solution extends ConceptDraw PRO software with templates, samples and library of vector stencils for drawing the metro maps, route maps, bus and other transport schemes, or design tube-style infographics.
 Area Charts
Area Charts are used to display the cumulative totals over time using numbers or percentages; or to show trends over time among related attributes. The Area Chart is effective when comparing two or more quantities. Each series of data is typically represented with a different color, the use of color transparency in an object’s transparency shows overlapped areas and smaller areas hidden behind larger areas.
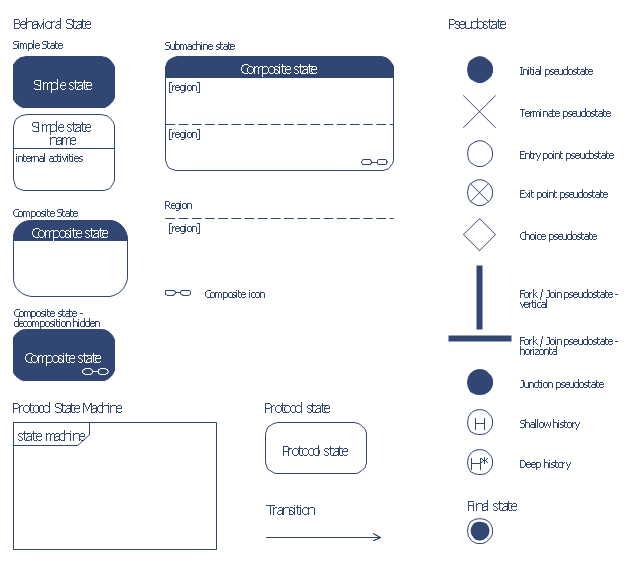
The vector stencils library "Bank UML state machine diagram" contains 21 shapes for drawing UML state machine diagrams.
Use it for object-oriented modeling of your bank information system.
"The state diagram in the Unified Modeling Language is essentially a Harel statechart with standardized notation, which can describe many systems, from computer programs to business processes. In UML 2 the name has been changed to State Machine Diagram. The following are the basic notational elements that can be used to make up a diagram:
* Filled circle, pointing to the initial state.
* Hollow circle containing a smaller filled circle, indicating the final state (if any).
* Rounded rectangle, denoting a state. Top of the rectangle contains a name of the state. Can contain a horizontal line in the middle, below which the activities that are done in that state are indicated.
* Arrow, denoting transition. The name of the event (if any) causing this transition labels the arrow body. A guard expression may be added before a "/ " and enclosed in square-brackets ( eventName[guardExpression] ), denoting that this expression must be true for the transition to take place. If an action is performed during this transition, it is added to the label following a "/ " ( eventName[guardExpression]/ action ).
* Thick horizontal line with either x>1 lines entering and 1 line leaving or 1 line entering and x>1 lines leaving. These denote join/ fork, respectively." [State machine diagram. Wikipedia]
This example of UML state machine diagram symbols for the ConceptDraw PRO diagramming and vector drawing software is included in the ATM UML Diagrams solution from the Software Development area of ConceptDraw Solution Park.
UML state machine diagram symbols
 Quality
This solution extends ConceptDraw PRO v9 and ConceptDraw MINDMAP v7 with Quality Management Diagrams (Total Quality Management Diagrams, Timelines, Workflows, Value Stream Maps) and Mind Maps (Presentations, Meeting Agendas, Problem to be solved).
 Metro Map
Metro Map solution extends ConceptDraw PRO software with templates, samples and library of vector stencils for drawing the metro maps, route maps, bus and other transport schemes, or design tube-style infographics.
- E-mail history - infographics
- UML communication diagram - Ticket processing system | Fully ...
- UML State Machine Diagram.Design Elements | Vector stencils ...
- Vector stencils library - State machine diagram | UML State Machine ...
- UML State Machine Diagram.Design Elements | Vector stencils ...
- ATM UML Diagrams | IVR services diagram | Entity-Relationship ...
- Vector stencils library - State machine diagram | UML state machine ...
- UML Deployment Diagram Example - ATM System | UML Diagram ...
- Basic Flowchart Symbols and Meaning | Vector stencils library ...
- IVR balance recharge diagram | IVR services diagram | UML activity ...
- UML Activity Diagram. Design Elements | UML activity diagram ...
- UML State Machine Diagram.Design Elements
- UML Activity Diagram
- ATM UML Diagrams | Model Based Systems Engineering | UML ...
- UML interaction overview diagrams | Vector stencils library - State ...
- UML activity diagram - Deposit slip processing | UML Diagram Tool ...
- UML activity diagram - Deposit slip processing | PM Meetings | Note ...
- UML activity diagram - Deposit slip processing | Entity-Relationship ...
- UML activity diagram - Deposit slip processing | UML Activity ...
- Geo Map - USA - Nevada | Mind Map Art History