This diagram example was redesigned from the Wikimedia Commons file: Operator hierarchy - natural hierarchy rearranged.gif.
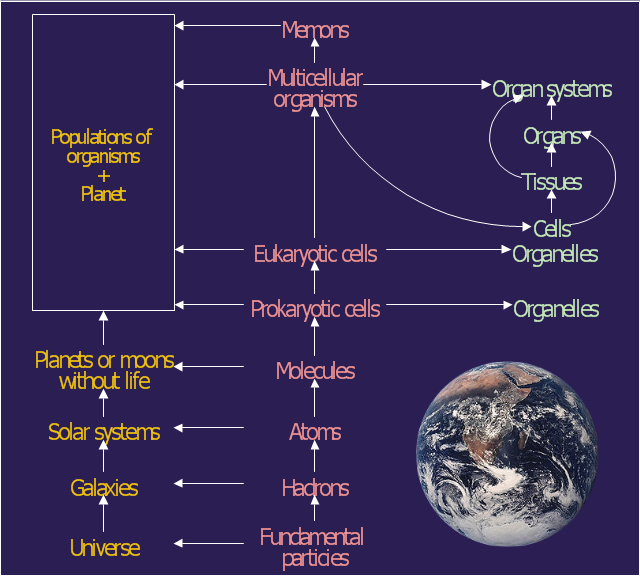
The diagram shows rearrangement of the classical ecological/ system hierarchy. From left to right the columns represent interaction systems, operators and internal differentiations (Gerard Jagers op Akkerhuis).
The diagram was published at page 249 of Jagers op Akkerhuis, G.A.J.M. (2010). The operator hierarchy: a chain of closures linking matter, life and artificial intelligence. PhD thesis Radboud university Nijmegen, the Netherlands: 286 pp.
[commons.wikimedia.org/ wiki/ File:Operator_ hierarchy_ -_ natural_ hierarchy_ rearranged.gif]
The astronomic diagram example "Operator hierarchy - Natural hierarchy rearranged" was created using the ConceptDraw PRO diagramming and vector drawing software extended with the Astronomy solution from the Science and Education area of ConceptDraw Solution Park.
Rearrangement of the classical ecological/system hierarchy
 Astronomy
Astronomy solution extends ConceptDraw PRO software with illustration and sketching software with templates, samples and libraries of a variety of astronomy symbols, including constellations, galaxies, stars, and planet vector shapes; a whole host of cele
Illustration Software

Types of Flowcharts


Pyramid Chart Examples

Solar System Symbols

Process Flow Maps

- Operator hierarchy - Natural hierarchy rearranged
- IVR mobile operator diagram | Operator hierarchy - Natural ...
- Graham's hierarchy of disagreement - Pyramid diagram
- Venn Diagram Examples for Problem Solving. Computer Science ...
- Venn Diagram Examples for Problem Solving. Computer Science ...
- Pyramid Diagrams | Development Of Information System Hierachy
- Basic Diagramming | Venn Diagram Examples for Problem Solving ...
- Video Production Hierarchy
- Venn Diagram Examples for Problem Solving. Computer Science ...
- COM and OLE Diagram | How to Create a Concept Map in ...
- Venn Diagram Examples for Problem Solving. Computer Science ...
- Interactive Voice Response Diagrams | How to Create an Interactive ...
- Venn Diagram Examples for Problem Solving. Environmental Social ...
- Venn Diagram Examples for Problem Solving. Computer Science ...
- And Operator
- Storage Hierarchy With Diagram
- Interactive Voice Response Diagrams | How to Create an Interactive ...
- Pyramid Diagram
- Www Diagram Of Storage Hierarchy Com
- Path to sustainable development | Sustainable development | Venn ...