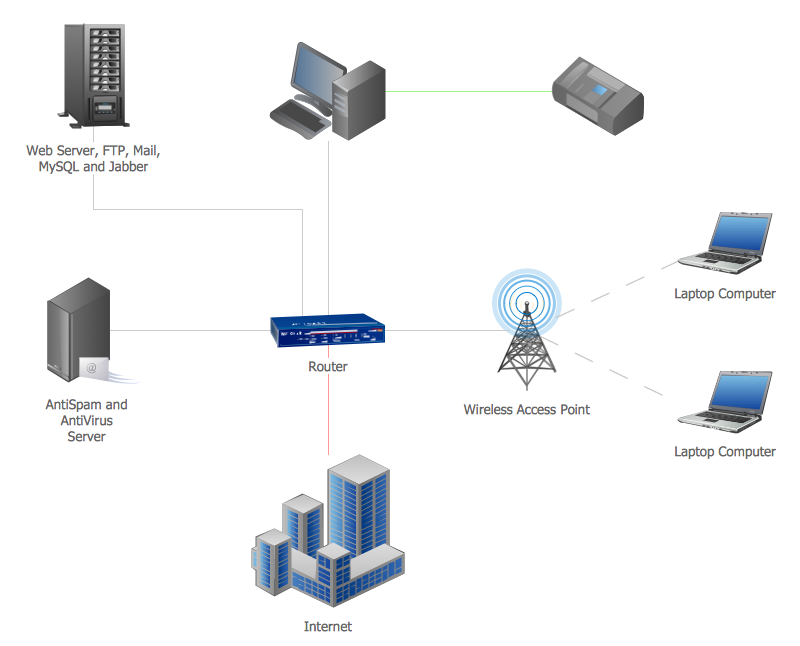
Local area network (LAN). Computer and Network Examples
 diagram")

Column Chart Software

Network Diagram Software. LAN Network Diagrams. Physical Office Network Diagrams

Area Network. Computer and Network Examples
Geo Map — Asia

 Picture Graphs
Typically, a Picture Graph has very broad usage. They many times used successfully in marketing, management, and manufacturing. The Picture Graphs Solution extends the capabilities of ConceptDraw DIAGRAM with templates, samples, and a library of professionally developed vector stencils for designing Picture Graphs.
 Bar Graphs
The Bar Graphs solution enhances ConceptDraw DIAGRAM functionality with templates, numerous professional-looking samples, and a library of vector stencils for drawing different types of Bar Graphs, such as Simple Bar Graph, Double Bar Graph, Divided Bar Graph, Horizontal Bar Graph, Vertical Bar Graph, and Column Bar Chart.
Basic Diagramming


 Cisco Network Diagrams
Cisco Network Diagrams solution extends ConceptDraw DIAGRAM with the best characteristics of network diagramming software. Included samples, templates and libraries of built-in standardized vector Cisco network icons and Cisco symbols of computers, network devices, network appliances and other Cisco network equipment will help network engineers, network designers, network and system administrators, as well as other IT professionals and corporate IT departments to diagram efficiently the network infrastructure, to visualize computer networks topologies, to design Cisco computer networks, and to create professional-looking Cisco Computer network diagrams, Cisco network designs and schematics, Network maps, and Network topology diagrams in minutes.
The 3D vertical bar graph sample shows the Iran internet users per 100 person from 2000 to 2011. It was designed on the base of the Commons Wikimedia file: Iran internet users per 100 person.png.
[commons.wikimedia.org/ wiki/ File:Iran_ internet_ users_ per_ 100_ person.png]
This file is licensed under the Creative Commons Attribution-Share Alike 3.0 Unported license. [creativecommons.org/ licenses/ by-sa/ 3.0/ deed.en]
The data source is World Bank: [data.worldbank.org/ country/ iran-islamic-republic]
"In 1993 Iran became the second country in the Middle East to be connected to the Internet, and since then the government has made significant efforts to improve the nation's ICT infrastructure. Iran's national Internet connectivity infrastructure is based on two major networks: the public switched telephone network (PSTN) and the public data network. The PSTN provides a connection for end-users to Internet service providers (ISPs) over mostly digital lines and supports modem-based connections. The Data Communication Company of Iran (DCI), a subsidiary of TCI, operates the public data network." [Internet in Iran. Wikipedia]
The 3D column chart example "Iran internet users per 100 person" was created using the ConceptDraw PRO diagramming and vector drawing software extended with the Bar Graphs solution from the Graphs and Charts area of ConceptDraw Solution Park.
3D Column chart

Mathematics Symbols

 Network Layout Floor Plans
Network Layout Floor Plans solution extends ConceptDraw DIAGRAM software functionality with powerful tools for quick and efficient documentation the network equipment and displaying its location on the professionally designed Network Layout Floor Plans. Never before creation of Network Layout Floor Plans, Network Communication Plans, Network Topologies Plans and Network Topology Maps was not so easy, convenient and fast as with predesigned templates, samples, examples and comprehensive set of vector design elements included to the Network Layout Floor Plans solution. All listed types of plans will be a good support for the future correct cabling and installation of network equipment.
The Best Mac Software for Diagramming or Drawing

Chart Software for Better Presentations

Visual Presentations Made Easy with Diagramming Software

- Graph Of Lan Man Wan
- Internet Connectivity. Computer and Network Examples | Internet ...
- Internet Connectivity. Computer and Network Examples ...
- Personal area (PAN) networks. Computer and Network Examples ...
- Mesh Network Topology Diagram | Network Topologies | Star ...
- ConceptDraw Solution Park | Process Flowchart | Local area ...
- Picture Of Local Area Network
- Examples of Flowcharts, Org Charts and More | Local area network ...
- Local area network ( LAN ). Computer and Network Examples ...
- Local area network ( LAN ). Computer and Network Examples ...
- Local area network ( LAN ). Computer and Network Examples ...
- Guesthouse Network. How to get Internet in guest house | Internet ...
- Bar Graphs | Network Glossary Definition | Compare Internet Security
- Design elements - Internet symbols | Internet symbols - Vector ...
- Local area network ( LAN ). Computer and Network Examples ...
- Network diagrams with ConceptDraw PRO | Picture Graphs | Active ...
- Local area network ( LAN ). Computer and Network Examples ...
- Internet solutions with ConceptDraw PRO | Internet Marketing ...
- Network Diagram Software LAN Network Diagrams & Diagrams for
- Local area network ( LAN ). Computer and Network Examples ...