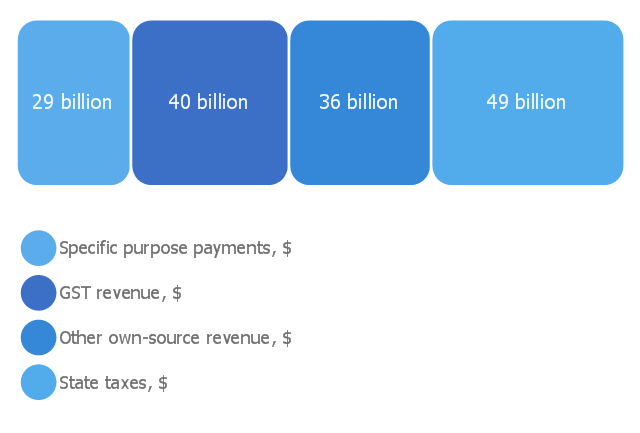
This divided bar diagram example shows the composition of Australian state government revenue in 2006‑07. It was drawn on the base of the chart "Composition of state government revenue in 2006‑07" from the Australia's future tax system website.
[taxreview.treasury.gov.au/ content/ Paper.aspx?doc=html/ publications/ papers/ report/ section_ 10-06.htm]
"Government revenue is money received by a government. It is an important tool of the fiscal policy of the government and is the opposite factor of government spending. Revenues earned by the government are received from sources such as taxes levied on the incomes and wealth accumulation of individuals and corporations and on the goods and services produced, exported and imported from the country, non-taxable sources such as government-owned corporations' incomes, central bank revenue and capital receipts in the form of external loans and debts from international financial institutions." [Government revenue. Wikipedia]
The divided bar diagram example "Composition of state government revenue in 2006‑07" was created using the ConceptDraw PRO diagramming and vector drawing software extended with the Basic Divided Bar Diagrams solution from the Graphs and Charts area of ConceptDraw Solution Park.
Divided bar chart
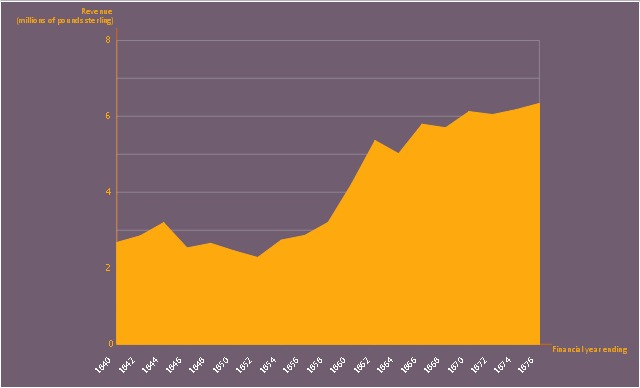
This area chart sample shows the revenue collected by the East India Company (after 1858 the British government) from salt (including inland and port taxes and sale of government salt). It was designed on the base of the Wikimedia Commons file: British India salt revenue 1840-1877.png.
[commons.wikimedia.org/ wiki/ File:British_ India_ salt_ revenue_ 1840-1877.png]
This file is licensed under the Creative Commons Attribution-Share Alike 3.0 Unported license. [creativecommons.org/ licenses/ by-sa/ 3.0/ deed.en]
"The Inland Customs Line which incorporated the Great Hedge of India (or Indian Salt Hedge[1]) was a customs barrier built by the British across India primarily to collect the salt tax. The customs line was begun while India was under the control of the East India Company but continued into the period of direct British rule. The line had its beginnings in a series of customs houses that were established in Bengal in 1803 to prevent the smuggling of salt to avoid the tax. These customs houses were eventually formed into a continuous barrier that was brought under the control of the Inland Customs Department in 1843." [Inland Customs Line. Wikipedia]
The area graph example "British India salt revenue 1840-1877" was created using the ConceptDraw PRO diagramming and vector drawing software extended with the Area Charts solution from the Graphs and Charts area of ConceptDraw Solution Park.
Area chart
Bar Diagram Math

 Divided Bar Diagrams
The Divided Bar Diagrams Solution extends the capabilities of ConceptDraw PRO v10 with templates, samples, and a library of vector stencils for drawing high impact and professional Divided Bar Diagrams and Graphs, Bar Diagram Math, and Stacked Graph.
Process Flowchart


- Composition of state government revenue in 2006‑07
- Divided Bar Diagrams | How to Draw a Divided Bar Chart in ...
- Divided Bar Diagrams
- State and local revenue and expenditures | State operating funds ...
- How to Draw a Divided Bar Chart in ConceptDraw PRO | Divided ...
- Revenue Flow Chart
- System Flowchart Diagram Design For Revenue
- Draw The Chart Of Government
- Tax Time 2013 - System availability and processing timeline | How ...
- Sales Process Flowchart. Flowchart Examples | Sales Process ...
- UML deployment diagram - Real estate transactions | Money ...
- Money - Design Elements | Money - Vector stencils library | Diagram ...
- Performance Indicators | Sales Dashboard | Constant improvement ...
- Basic Flowchart Symbols and Meaning | Process Flowchart ...
- Business and Finance | Audit Flowcharts | Money - Vector stencils ...
- Sales KPIs - Performance dashboard | Sales geographically ...
- UML use case diagram - Banking system | UML activity diagram ...
- Business People Clipart | Advertising - Design Elements ...
- Performance Indicators | What is a KPI? | Constant improvement of ...