Pyramid Diagram

This area chart sample shows the US federal prisoner population changes from 1914 to 2010.
"The Federal Bureau of Prisons (BOP) is a United States federal law enforcement agency. A subdivision of the U.S. Department of Justice, the Bureau is responsible for the administration of the federal prison system. The system also handles prisoners who committed acts considered felonies under the District of Columbia's law. The Bureau was established in 1930 to provide more progressive and humane care for federal inmates, to professionalize the prison service, and to ensure consistent and centralized administration of the 11 federal prisons in operation at the time.
According to its official web site, the Bureau consists of more than 116 institutions, six regional offices, its headquarters office in Washington, D.C., two staff training centers, and 22 community corrections offices, and is responsible for the custody and care of approximately 210,000 federal offenders. Approximately 82 percent of these inmates are confined in Bureau-operated correctional facilities or detention centers. The remainder are confined through agreements with state and local governments or through contracts with privately operated community corrections centers, detention centers, prisons, and juvenile facilities." [Federal Bureau of Prisons. Wikipedia]
This area graph sample was redesigned from the Wikimedia Commons file: Federal timeline US prisoners.gif. [commons.wikimedia.org/ wiki/ File:Federal_ timeline_ US_ prisoners.gif]
The area chart example "Federal timeline US prisoners" was created using the ConceptDraw PRO diagramming and vector drawing software extended with the Area Charts solution from the Graphs and Charts area of ConceptDraw Solution Park.
Area graph

"In electronics, a vacuum tube, electron tube (in North America), tube, or thermionic valve or valve (in British English) is a device controlling electric current through a vacuum in a sealed container. The simplest vacuum tube, the diode, contains only two elements; current can only flow in one direction through the device between the two electrodes, as electrons emitted by the hot cathode travel through the tube and are collected by the anode. Addition of a third and additional electrodes allows the current flowing between cathode and anode to be controlled in various ways. The device can be used as an electronic amplifier, a rectifier, an electronically controlled switch, an oscillator, and for other purposes.
Vacuum tubes mostly rely on thermionic emission of electrons from a hot filament or a cathode heated by the filament. Some electron tube devices rely on the properties of a discharge through an ionized gas." [Vacuum tube. Wikipedia]
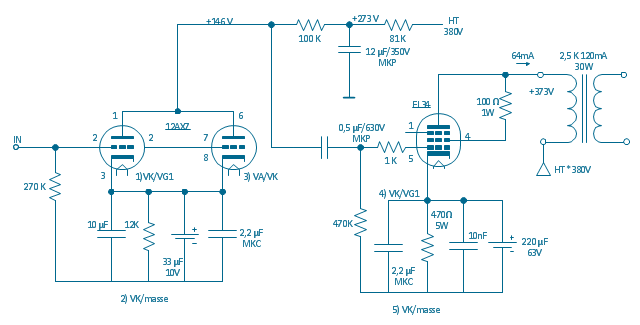
"The EL34 is a thermionic valve or vacuum tube of the power pentode type. It has an international octal base (indicated by the '3' in the part number) and is found mainly in the final output stages of audio amplification circuits and was designed to be suitable as a series regulator by virtue of its high permissible voltage between heater and cathode and other parameters. The American RETMA tube designation number for this tube is 6CA7. Russian analog is 6P27S (Cyrillic: 6П27C )" [EL34. Wikipedia]
This circuit diagram sample was redrawn from the Wikipedia Commons file: EL34 schematics (circuit diagram).gif. [commons.wikimedia.org/ wiki/ File:EL34_ schematics_ %28circuit_ diagram%29.gif]
The example "Circuit diagram - EL 34 schematics" was drawn using the ConceptDraw PRO diagramming and vector drawing software extended with the Electrical Engineering solution from the Engineering area of ConceptDraw Solution Park.
Vacuum tubes mostly rely on thermionic emission of electrons from a hot filament or a cathode heated by the filament. Some electron tube devices rely on the properties of a discharge through an ionized gas." [Vacuum tube. Wikipedia]
"The EL34 is a thermionic valve or vacuum tube of the power pentode type. It has an international octal base (indicated by the '3' in the part number) and is found mainly in the final output stages of audio amplification circuits and was designed to be suitable as a series regulator by virtue of its high permissible voltage between heater and cathode and other parameters. The American RETMA tube designation number for this tube is 6CA7. Russian analog is 6P27S (Cyrillic: 6П27C )" [EL34. Wikipedia]
This circuit diagram sample was redrawn from the Wikipedia Commons file: EL34 schematics (circuit diagram).gif. [commons.wikimedia.org/ wiki/ File:EL34_ schematics_ %28circuit_ diagram%29.gif]
The example "Circuit diagram - EL 34 schematics" was drawn using the ConceptDraw PRO diagramming and vector drawing software extended with the Electrical Engineering solution from the Engineering area of ConceptDraw Solution Park.
EL34 shemathics
Diagramming tool - Amazon Web Services and Cloud Computing Diagrams

This interactive voice response (IVR) diagram sample shows the Voice over IP (VoIP) signalling protocol stack. It was designed on the base of the Wikimedia Commons file: Pvoip.gif. [commons.wikimedia.org/ wiki/ File:Pvoip.gif]
This file is licensed under the Creative Commons Attribution-Share Alike 3.0 Unported license. [creativecommons.org/ licenses/ by-sa/ 3.0/ deed.en]
"A VoIP phone or IP phone uses Voice over IP technologies for placing and transmitting telephone calls over an IP network, such as the Internet, instead of the traditional public switched telephone network (PSTN).
Digital IP-based telephone service uses control protocols such as the Session Initiation Protocol (SIP), Skinny Client Control Protocol (SCCP) or various other proprietary protocols." [VoIP phone. Wikipedia]
The IVR diagram example "VoIP protocols" was designed using ConceptDraw PRO diagramming and vector drawing software extended with the Interactive Voice Response Diagrams solution from the Computer and Networks area of ConceptDraw Solution Park.
IVR diagram

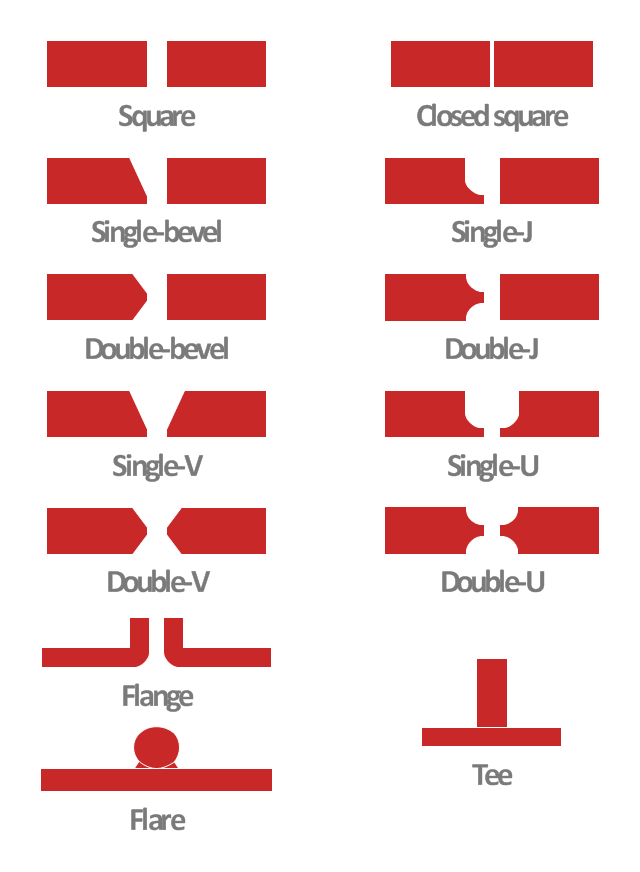
This engineering drawing shows different types of geometry of butt welds.
"Welds can be geometrically prepared in many different ways. The five basic types of weld joints are the butt joint, lap joint, corner joint, edge joint, and T-joint (a variant of this last is the cruciform joint). Other variations exist as well - for example, double-V preparation joints are characterized by the two pieces of material each tapering to a single center point at one-half their height. Single-U and double-U preparation joints are also fairly common - instead of having straight edges like the single-V and double-V preparation joints, they are curved, forming the shape of a U. Lap joints are also commonly more than two pieces thick - depending on the process used and the thickness of the material, many pieces can be welded together in a lap joint geometry." [Welding. Wikipedia]
This engineering drawing example was redesigned using the ConceptDraw PRO diagramming and vector drawing software from the Wikimedia Commons file: Butt Weld Geometry.GIF.
[commons.wikimedia.org/ wiki/ File:Butt_ Weld_ Geometry.GIF]
The engineering drawing example "Butt weld geometry" is included in the Mechanical Engineering solution from the Engineering area of ConceptDraw Solution Park.
Welding joint diagram
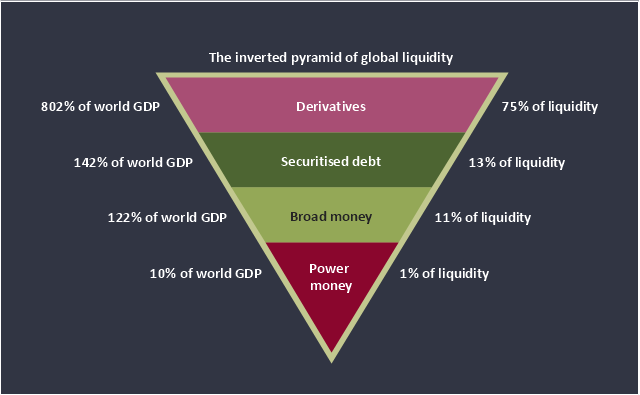
This inverted pyramid diagram of global liquidity shows world GDP and liquidity for 4 levels: derivatives, securitised debt, broad money, and power money.
"In business, economics or investment, market liquidity is a market's ability to facilitate an asset being sold quickly without having to reduce its price very much (or even at all). Equivalently, an asset's market liquidity (or simply "an asset's liquidity") is the asset's ability to sell quickly without having to reduce its price very much. Liquidity is about how big the trade-off is between the speed of the sale and the price it can be sold for. In a liquid market, the trade-off is mild: selling quickly will not reduce the price much. In a relatively illiquid market, selling it quickly will require cutting its price by some amount.
Money, or cash, is the most liquid asset, because it can be "sold" for goods and services instantly with no loss of value. There is no wait for a suitable buyer of the cash. There is no trade-off between speed and value. It can be used immediately to perform economic actions like buying, selling, or paying debt, meeting immediate wants and needs.
If an asset is moderately (or very) liquid, it has moderate (or high) liquidity. In an alternative definition, liquidity can mean the amount of highly liquid assets. If a business has moderate liquidity, it has a moderate amount of very liquid assets. If a business has sufficient liquidity, it has a sufficient amount of very liquid assets and the ability to meet its payment obligations." [Market liquidity. Wikipedia]
This inverted triangle diagram was redesigned using the ConceptDraw PRO diagramming and vector drawing software from Wikimedia Commons file The inverted pyramid of global liquidity.gif. [commons.wikimedia.org/ wiki/ File:The_ inverted_ pyramid_ of_ global_ liquidity.gif]
This triangular chart example is included in the Pyramid Diagrams solution from the Marketing area of ConceptDraw Solution Park.
Inverted pyramid diagram
Bar Diagrams for Problem Solving. Create manufacturing and economics bar charts with Bar Graphs Solution

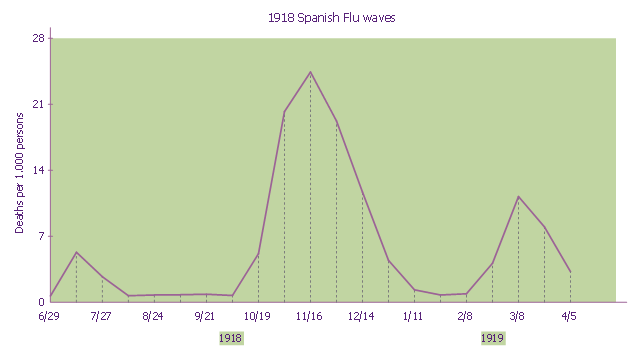
This line graph sample shows three pandemic waves: weekly combined influenza and pneumonia mortality, United Kingdom, 1918–1919. It was designed on the base of the Wikimedia Commons file: 1918 spanish flu waves.gif. [commons.wikimedia.org/ wiki/ File:1918_ spanish_ flu_ waves.gif]
"The 1918 flu pandemic (January 1918 – December 1920) was an unusually deadly influenza pandemic, the first of the two pandemics involving H1N1 influenza virus. It infected 500 million people across the world, including remote Pacific islands and the Arctic, and resulted in the deaths of 50 to 100 million (three to five percent of the world's population), making it one of the deadliest natural disasters in human history." [1918 flu pandemic. Wikipedia]
The line chart example "1918 Spanish Flu waves" was created using the ConceptDraw PRO diagramming and vector drawing software extended with the Line Graphs solution from the Graphs and Charts area of ConceptDraw Solution Park.
Line chart
Business Process Modeling Notation Template
 B2B process diagram BPMN 2.0 - Cab booking process")
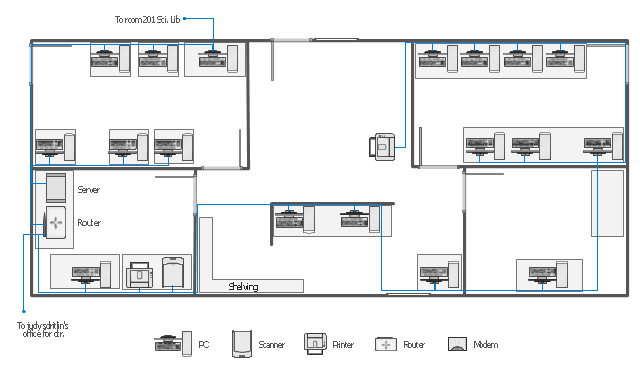
This network layout floorplan example was drawn on the base of the picture "Ethernet cable layout" illustrating "UGA Technical Network Liaison Handbook" from the website of the University of Georgia.
[netinfo.uga.edu/ tnlhand/ landiag.gif]
"The Ethernet physical layer is the physical layer component of the Ethernet family of computer network standards.
The Ethernet physical layer evolved over a considerable time span and encompasses quite a few physical media interfaces and several magnitudes of speed. The speed ranges from 1 Mbit/ s to 100 Gbit/ s, while the physical medium can range from bulky coaxial cable to twisted pair and optical fiber. In general, network protocol stack software will work similarly on all physical layers.
10-gigabit Ethernet was already used in both enterprise and carrier networks by 2007, with 40 Gbit/ s and 100 Gbit/ s Ethernet ratified." [Ethernet physical layer. Wikipedia]
The network layout floorplan example "Ethernet cable layout" was created using the ConceptDraw PRO diagramming and vector drawing software extended with the Network Layout Floor Plans solution from the Computer and Networks area of ConceptDraw Solution Park.
Network layout floorplan
Simple Baseball Field – Sample

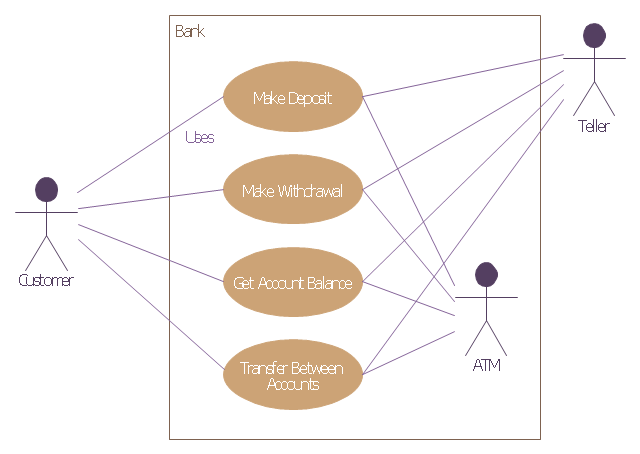
This example of bank ATM UML activity diagram was created on the base of UML use case diagram of automated teller machine from the course "Thinking in Java, 2nd edition, Revision 9" by Bruce Eckel published on the website of the Computer Science and Electrical Engineering Department of the University of Maryland, Baltimore (UMBC).
"If you are designing an auto-teller, for example, the use case for a particular aspect of the functionality of the system is able to describe what the auto-teller does in every possible situation. Each of these “situations” is referred to as a scenario, and a use case can be considered a collection of scenarios. You can think of a scenario as a question that starts with: “What does the system do if...?” For example, “What does the auto-teller do if a customer has just deposited a check within the last 24 hours, and there’s not enough in the account without the check having cleared to provide a desired withdrawal?”
Use case diagrams are intentionally simple to prevent you from getting bogged down in system implementation details prematurely...
Each stick person represents an “actor,” which is typically a human or some other kind of free agent. (These can even be other computer systems, as is the case with “ATM.”) The box represents the boundary of your system. The ellipses represent the use cases, which are descriptions of valuable work that can be performed with the system. The lines between the actors and the use cases represent the interactions.
It doesn’t matter how the system is actually implemented, as long as it looks like this to the user."
[csee.umbc.edu/ courses/ 331/ resources/ tij/ text/ TIJ213.gif]
This automated teller machine (ATM) UML use case diagram example was created using the ConceptDraw PRO diagramming and vector drawing software extended with the ATM UML Diagrams solution from the Software Development area of ConceptDraw Solution Park.
Bank ATM UML sequence diagram
This DFD sample was created on the base of the figure illustrating "A Survey of Object-Oriented Methods" by Peter Biggs from University of Durham.
[students.cs.byu.edu/ ~pbiggs/ images/ coadsys.gif]
"Object-oriented analysis and design (OOAD) is a popular technical approach to analyzing, designing an application, system, or business by applying the object-oriented paradigm and visual modeling throughout the development life cycles to foster better stakeholder communication and product quality.
According to the popular guide Unified Process, OOAD in modern software engineering is best conducted in an iterative and incremental way. Iteration by iteration, the outputs of OOAD activities, analysis models for OOA and design models for OOD respectively, will be refined and evolve continuously driven by key factors like risks and business values." [Object-oriented analysis and design. Wikipedia]
The DFD example "Coad/ Yourdon's Object-Oriented Analysis model" was created using the ConceptDraw PRO diagramming and vector drawing software extended with the Data Flow Diagrams solution from the Software Development area of ConceptDraw Solution Park.
DFD
- Loading Bar Gif
- Mechanical Engineering Diagram Gif
- Electrical Wiring Diagram Software Gif
- Circuit diagram - EL 34 schematics | International Gif
- Gif Animated Arrow
- Process Flowchart | Progress Bar Animated Gif
- Butt weld geometry | Lap Joint Gif
- Earth Gif
- ConceptDraw PRO ER Diagram Tool | Kpi Animation Gif
- Word Exchange | Loading Bar Gif Transparent Background
- Process Flowchart | Progress Bar Horizontal Transparent Gif
- Process Flowchart | Animated Gif Images For Progress Bar
- Loading Gif
- Progress Bar Gif Image
- Gif Machine
- Loading Bar Animated Gif Transparent
- Loading Gif Image Transparent Background
- Sales dashboard - Vector stencils library | Loading Bar Gif Transparent
- Entity Relationship Diagram Symbols | Ship Gif Animation
- Hydraulic schematic | Turbine Gif