 ATM UML Diagrams
The ATM UML Diagrams solution lets you create ATM solutions and UML examples. Use ConceptDraw DIAGRAM as a UML diagram creator to visualize a banking system.
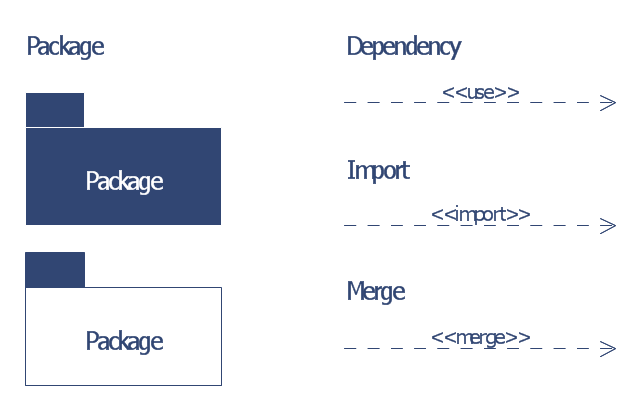
The vector stencils library "Bank UML package diagram" contains 5 shapes for drawing UML package diagrams.
Use it for object-oriented modeling of your bank information system.
"A package diagram in the Unified Modeling Language depicts the dependencies between the packages that make up a model.
In addition to the standard UML Dependency relationship, there are two special types of dependencies defined between packages:
* package import,
* package merge.
Elements.
1. Package: a general purpose mechanism for organizing model elements & diagrams into groups. It provides an encapsulated namespace within which all the names must be unique. It is used to group semantically related elements. It is a namespace as well as an element that can be contained in other packages' namespaces.
2. Class: a representation of an object that reflects its structure and behavior within the system. It is a template from which running instances are created. Classes usually describe the logical structure of the system.
3. Interface: a specification of behavior. An implementation class must be written to support the behavior of an interface class.
4. Object: an instance of a class. It is often used in analysis to represent an artifact or other item.
5. Table: a stereotyped class." [Package diagram. Wikipedia]
This example of UML package diagram symbols for the ConceptDraw PRO diagramming and vector drawing software is included in the ATM UML Diagrams solution from the Software Development area of ConceptDraw Solution Park.
UML package diagram symbols
IDEF0 Diagram

UML Diagram

Flowchart on Bank. Flowchart Examples


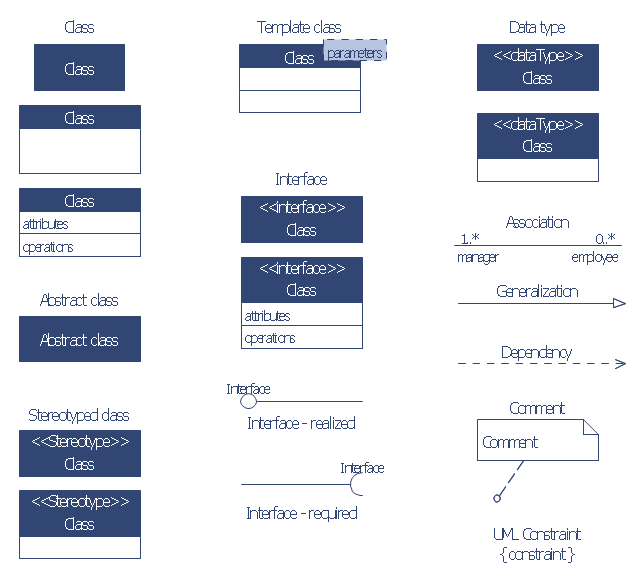
The vector stencils library "Bank UML class diagram" contains 19 shapes for drawing UML class diagrams.
Use it for object-oriented modeling of your bank information system.
"The class diagram is the main building block of object oriented modelling. It is used both for general conceptual modelling of the systematics of the application, and for detailed modelling translating the models into programming code. Class diagrams can also be used for data modeling. The classes in a class diagram represent both the main objects, interactions in the application and the classes to be programmed.
In the diagram, classes are represented with boxes which contain three parts:
* The top part contains the name of the class. It is printed in bold and centered, and the first letter is capitalized.
* The middle part contains the attributes of the class. They are left-aligned and the first letter is lowercase.
* The bottom part contains the methods the class can execute. They are also left-aligned and the first letter is lowercase.
In the design of a system, a number of classes are identified and grouped together in a class diagram which helps to determine the static relations between those objects. With detailed modelling, the classes of the conceptual design are often split into a number of subclasses." [Class diagram. Wikipedia]
This example of UML class diagram symbols for the ConceptDraw PRO diagramming and vector drawing software is included in the ATM UML Diagrams solution from the Software Development area of ConceptDraw Solution Park.
UML class diagram symbols
UML for Bank

Data Flow Diagram

UML Collaboration Diagram. Design Elements

Data Flow Diagram Process

- Banking system
- Bank System | Banking System | Class UML Diagram for Bank ...
- State Machine Diagram | UML Use Case Diagram Example ...
- ATM System UML diagrams
- How to Create a Bank ATM Use Case Diagram | ATM UML ...
- SYSML | Model Based Systems Engineering | ATM UML Diagrams ...
- ATM UML Diagrams
- ATM Sequence diagram | UML activity diagram - Cash withdrawal ...
- ATM UML Diagrams | Design elements - Bank UML package ...
- ATM UML Diagrams | How to Create a Bank ATM Use Case ...