Pyramid Diagram and Pyramid Chart

HelpDesk
How to Draw a Pie Chart

Circular Flow Diagram Template
 Circular Arrows Diagrams
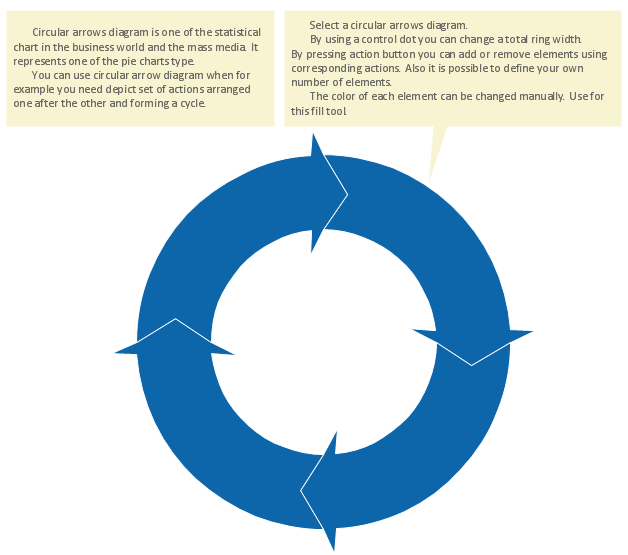
Circular Arrows Diagrams solution extends ConceptDraw DIAGRAM with extensive drawing tools, predesigned samples, Circular flow diagram template for quick start, and a library of ready circular arrow vector stencils for drawing Circular Arrow Diagrams, Segmented Cycle Diagrams, and Circular Flow Diagrams. The elements in this solution help managers, analysts, business advisers, marketing experts, scientists, lecturers, and other knowledge workers in their daily work.
Pyramid Charts

Circular Arrow
 Fishbone Diagram
Fishbone Diagrams solution extends ConceptDraw DIAGRAM software with templates, samples and library of vector stencils for drawing the Ishikawa diagrams for cause and effect analysis.
Computer Hardware - Reseller Business Plan

 Education Package
Education Package is a comprehensive set of multifarious graphical solutions from ConceptDraw Solution Park, collected together in help to ConceptDraw DIAGRAM users working in a field of science, education and training, which is aimed at improving the quality of education and helping to design with ease variety of interesting and colorful educational materials, diagrams, charts and maps. Use it to present the information and knowledge in an interesting, clear, structured and simple form to achieve a success in education and pedagogy, to maintain the interest of students and pupils throughout the whole learning process, at the lectures, lessons and even during independent work with additional materials, to contribute to better perception of scientific information by listeners during the conferences and reports.
 Business Process Mapping
The Business Process Mapping solution for ConceptDraw DIAGRAM is for users involved in process mapping and creating SIPOC diagrams.
 Basic Circular Arrows Diagrams
This solution extends ConceptDraw DIAGRAM (or later) with samples, templates, and a library of vector stencils for drawing circular arrow diagrams.
Business Package for Management
Package intended for professional who designing and documenting business processes, preparing business reports, plan projects and manage projects, manage organizational changes, prepare operational instructions, supervising specific department of an organization, workout customer service processes and prepare trainings for customer service personal, carry out a variety of duties to organize business workflow.
Circular Arrows
The vector stencils library "Circular diagrams" contains 42 templates of circular diagrams: circular arrow diagram, circular motion diagram, arrow ring chart, doughnut chart (donut chart), circle pie chart, diamond pie chart, circle diagram, pie chart, ring chart, loop diagram, block loop diagram, arrow loop circle, crystal diagram, triangular diagram, diamond diagram, pentagon diagram, hexagon diagram, heptagon diagram, cycle diagram (cycle chart), stacked Venn diagram (onion diagram), arrow circle diagram.
Use these shapes to illustrate your marketing and sales documents, presentations, webpages and infographics in the ConceptDraw PRO diagramming and vector drawing software extended with the Target and Circular Diagrams solution from the Marketing area of ConceptDraw Solution Park.
www.conceptdraw.com/ solution-park/ marketing-target-and-circular-diagrams
Circular arrow diagram 1
Circular arrow diagram 2
Arrow ring chart
Doughnut chart

Diamond pie chart

Pie chart

Circle diagram

Circle pie chart 2

Circle pie chart 1

Ring chart 1 - 3 elements

Ring chart 1 - 4 elements

Ring chart 1 - 5 elements

Ring chart 1 - 6 elements

Ring chart 1 - 7 elements

Ring chart 2 - 3 elements

Ring chart 2 - 4 elements

Ring chart 2 - 5 elements

Ring chart 2 - 6 elements

Ring chart 2 - 7 elements

Crystal diagram - 3 elements

Crystal diagram - 4 elements

Crystal diagram - 5 elements

Crystal diagram - 6 elements

Crystal diagram - 7 elements

Stacked Venn diagram - 4

Stacked Venn diagram - 5

Stacked Venn diagram - 6

Stacked Venn diagram - 7

Basic loop diagram

Block loop diagram

Arrow loop circle
Arrow loop - 3 circles
Arrow loop - 4 circles
Arrow loop - 5 circles
Arrow loop - 6 circles
Arrow loop - 7 circles
Arrow circle diagram - 3
Arrow circle diagram - 4
Stacked Venn diagram - 3

Arrow circle diagram - 5
Arrow circle diagram - 6
Arrow circle diagram - 7
- Market Segmentation Flowchart
- Flowchart Marketing Process. Flowchart Examples | Flowchart ...
- Market Segmentation Flow Chart Example With Company Flow Chart
- Venn Diagram For Market Segmentation
- Diagram Of Market Segment And Market Targeting
- Segmented pyramid diagram - Template | Pyramid Diagram and ...
- Marketing Diagrams | Marketing Analysis Diagram | Flowchart ...
- Markets Hare With Flowchart Examples
- Process Flowchart | Flowchart Marketing Process. Flowchart ...
- Marketing Segmentation Of Onion Sales
- Marketing Segmentation Block Diagram
- Marketing Analysis Diagram | Flowchart Marketing Process ...
- Circular Flow Diagram Template | Fishbone Diagram | Circular ...
- Flow Chart Of Different Segment Related To Tertiary Sector
- Marketing mix - Wheel diagram | Target diagrams - Vector stencils ...
- Flowchart Example: Flow Chart of Marketing Analysis | Marketing ...
- Competitor Analysis | Marketing plan - Circular diagram | Flowchart ...
- Competitor Analysis | Flowchart Example: Flow Chart of Marketing ...
- Flowchart Marketing Process. Flowchart Examples | Marketing ...