Pyramid Diagram and Pyramid Chart

Circular Flow Diagram Template
Sales Steps

HelpDesk
How to Draw a Pie Chart

HelpDesk
How to Create a Venn Diagram

Pyramid Diagram

Pyramid Charts

HelpDesk
How to Draw a Divided Bar Chart

Circular Arrows
How To Create Onion Diagram

HelpDesk
How to Draw a Pyramid Diagram

Circular Arrow

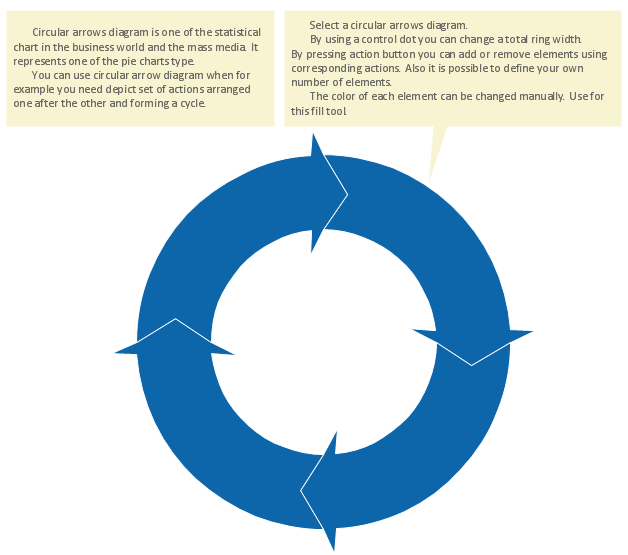
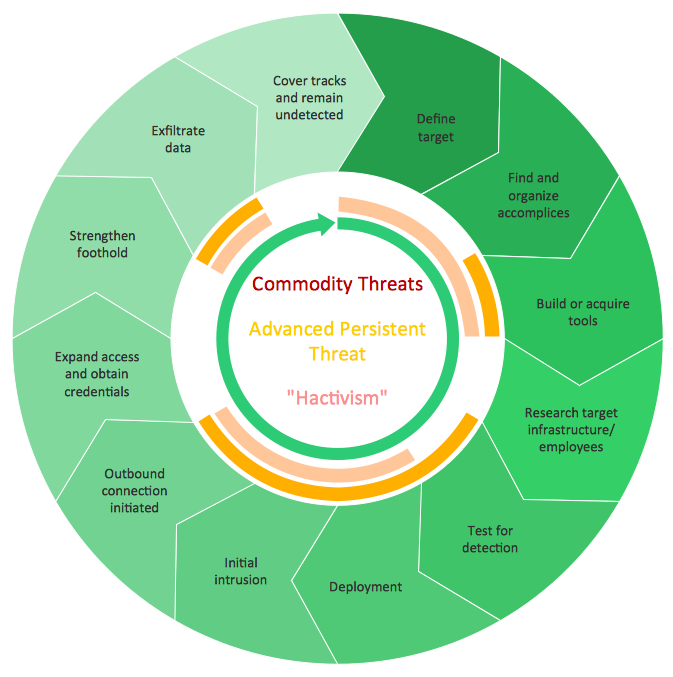
 Circular Arrows Diagrams
Circular Arrows Diagrams solution extends ConceptDraw DIAGRAM with extensive drawing tools, predesigned samples, Circular flow diagram template for quick start, and a library of ready circular arrow vector stencils for drawing Circular Arrow Diagrams, Segmented Cycle Diagrams, and Circular Flow Diagrams. The elements in this solution help managers, analysts, business advisers, marketing experts, scientists, lecturers, and other knowledge workers in their daily work.
- Marketing Diagrams | Marketing | Six Markets Model Chart | Marketing
- Flow Charts For Market Segmentation
- Market Segmentation With Flow Chart
- Process Of Segmentation In Marketing Flow Chart
- Market Segmentation Flowchart
- Circular Diagram | Circular Flow Diagram Template | How to Draw a ...
- Venn Diagram For Market Segmentation
- Circular Diagram
- Marketing Diagrams | Marketing Analysis Diagram | Marketing ...
- Marketing Diagrams | Flowchart Marketing Process. Flowchart ...
- Pyramid Diagram and Pyramid Chart | Circular Flow Diagram ...
- Service-goods continuum diagram | Process Flowchart | Copying ...
- Marketing Diagrams | Flowchart Marketing Process. Flowchart ...
- Circular Arrows Diagrams | Create Response Charts | Gant Chart in ...
- The Circular Flow Diagram
- Copying Service Process Flowchart . Flowchart Examples | Process ...
- Circular Arrows | Circular Flow Diagram Template | Circular Arrows ...
- Service-goods continuum diagram | Process Flowchart | Pyramid ...
- Circle-spoke diagram - Target market | Target Diagram | Circle ...
- Marketing mix - Wheel diagram | Marketing mix diagram | Target ...