This VANET diagram example was drawn on the base of picture from the webpage "Security and Privacy in Location-based MANETs/ VANETs" from the Donald Bren School of Information and Computer Sciences, the University of California, Irvine. [ics.uci.edu/ ~keldefra/ manet.htm]
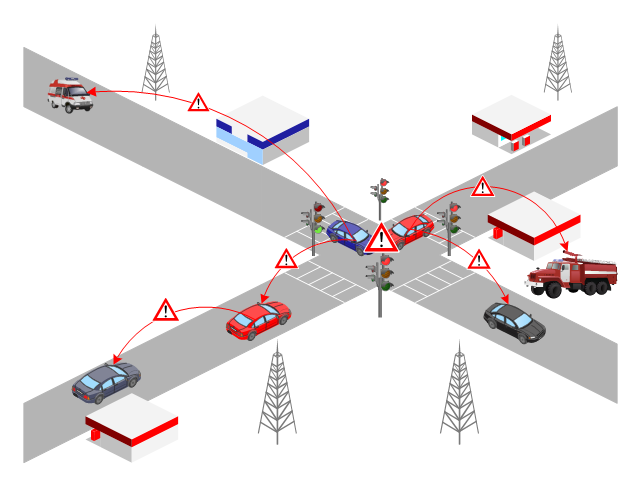
"A vehicular ad hoc network (VANET) uses cars as mobile nodes in a MANET to create a mobile network. A VANET turns every participating car into a wireless router or node, allowing cars approximately 100 to 300 metres of each other to connect and, in turn, create a network with a wide range. As cars fall out of the signal range and drop out of the network, other cars can join in, connecting vehicles to one another so that a mobile Internet is created. It is estimated that the first systems that will integrate this technology are police and fire vehicles to communicate with each other for safety purposes. Automotive companies like General Motors, Toyota, Nissan, DaimlerChrysler, BMW and Ford promote this term." [Vehicular ad hoc network. Wikipedia]
The VANET diagram example "Vehicular ad-hoc network" was created using the ConceptDraw PRO diagramming and vector drawing software extended with the Vehicular Networking solution from the Computer and Networks area of ConceptDraw Solution Park.
VANET diagram
Used Solutions
Maps
>
 Network Security Diagrams
The Network Security Diagrams solution presents a large collection of predesigned cybersecurity vector stencils, cliparts, shapes, icons and connectors to help you succeed in designing professional and accurate Network Security Diagrams, Network Security Infographics to share knowledge about effective ways of networks protection with help of software and network security devices of different cyber security degrees, Network Plans for secure wireless network, Computer Security Diagrams to visually tell about amazing possibilities of IT security solutions. The samples and examples reflect the power of ConceptDraw PRO software in drawing Network Security Diagrams, give the representation about variety of existing types of attacks and threats, help to realize their seriousness and the methods to deal with them.
 25 Typical Orgcharts
The 25 Typical Orgcharts solution contains powerful organizational structure and organizational management drawing tools, a variety of professionally designed organization chart and matrix organization structure samples, 25 templates based on various orga
 iPhone User Interface
iPhone User Interface solution extends ConceptDraw PRO v10 software with templates, samples and libraries with large quantity of vector stencils of graphical user interface elements, Apps icons, UI patterns for designing and prototyping of the iOS applic
 Cross-Functional Flowcharts
Cross-functional flowcharts are powerful and useful tool for visualizing and analyzing complex business processes which requires involvement of multiple people, teams or even departments. They let clearly represent a sequence of the process steps, the order of operations, relationships between processes and responsible functional units (such as departments or positions).
 Event-driven Process Chain Diagrams
Event-driven Process Chain (EPC) Diagram is a type of flowchart widely used for modeling in business engineering and reengineering, business process improvement, and analysis. EPC method was developed within the Architecture of Integrated Information Systems (ARIS) framework.
 Project Management Area
Project Management area provides Toolbox solutions to support solving issues related to planning, tracking, milestones, events, resource usage, and other typical project management functions.
- Fire Safety Diagram
- Fire Exit Plan. Building Plan Examples | Emergency Plan ...
- SWOT analysis matrix diagram templates | Software for Creating ...
- Vehicular ad-hoc network
- Create Organizational Chart | Emergency Plan | Hospital Design ...
- Emergency Plan | Work Order Process Flowchart. Business Process ...
- Create Organizational Chart | Process Flowchart | ConceptDraw ...
- Bubble Diagram Hotel
- Create a Presentation Using a Design Template | How To Do A Mind ...
- Sales Flowcharts | Floor Plans | Process Flowchart | Flowchart Of Hotel
- Fire Exit Plan. Building Plan Examples | Emergency Plan ...
- How To Create Restaurant Floor Plan in Minutes | Emergency Plan ...
- Create a Floor Plan
- Emergency Plan | Create a Floor Plan | Hotel Floorplan | How To ...
- Building Drawing Software for Design Office Layout Plan ...
- Financial Trade UML Use Case Diagram Example | Credit Card ...
- How To Do A Mind Map In PowerPoint | How to Create a PowerPoint ...
- Process Flowchart | Banquet Hall Plan Software | Sales Flowcharts ...
- How to draw Metro Map style infographics? Moscow, New York, Los ...
- UML Class Diagram Example - Buildings and Rooms | Fire Exit Plan ...