Restaurant Floor Plans

 ConceptDraw Solution Park
ConceptDraw Solution Park collects graphic extensions, examples and learning materials
HelpDesk
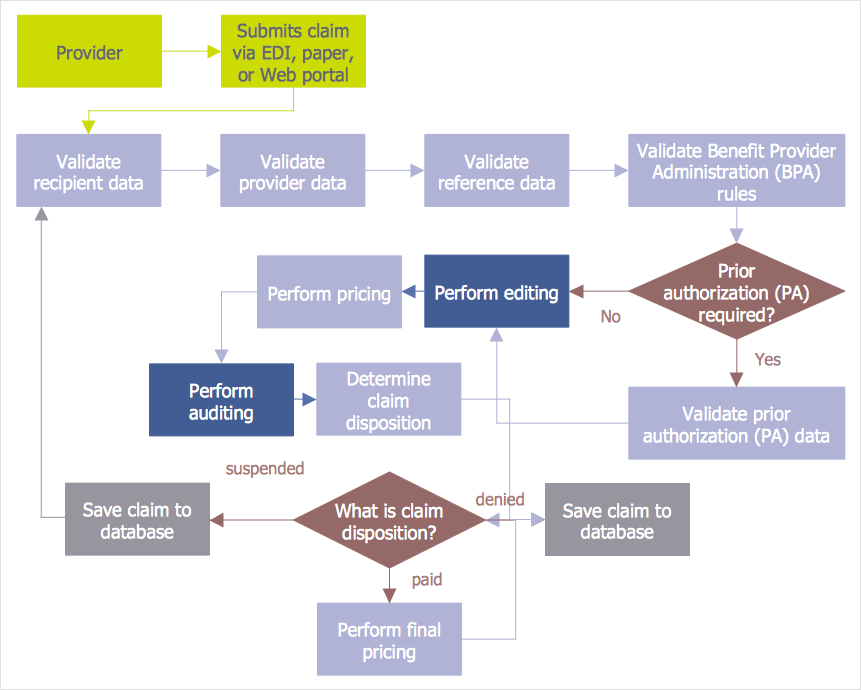
How to Create an Audit Flowchart
 Business and Finance
Use Business and Finance solution to make professional-looking documents, presentations and websites, business, finance, advertising, and project management illustrations, or any designs that requires clipart of currency, office, business, advertising, management, marketing, people, time, post, contacts, collaboration, etc.
Example of Organizational Chart


Best Program to Make Workflow Diagrams
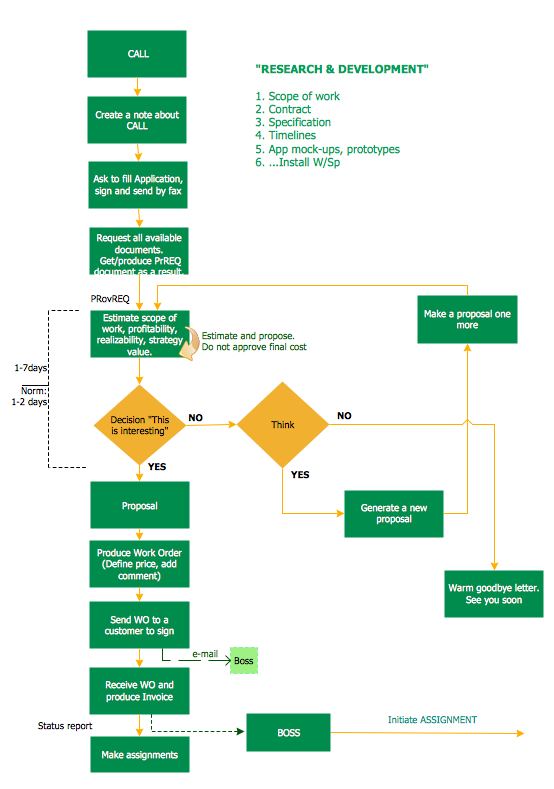
Remote Projects in Corporate Strategy


 Accounting Flowcharts
Accounting Flowcharts solution extends ConceptDraw DIAGRAM software with templates, samples and library of vector stencils for drawing the accounting flow charts.
Business diagrams & Org Charts with ConceptDraw DIAGRAM


Draw Company Structure with Organization Charting Software

Draw Company Structure Diagram - get the detailed information about the company structure and hierarchy - who execute what tasks and who is in charge at this company. This information shows the reasoning and success of business and is indispensable for investors and financial institutions.
 Quality Mind Map
This solution extends ConceptDraw MINDMAP software with Quality Management Mind Maps (Presentations, Meeting Agendas, Problem to be solved).
 Venn Diagrams
Venn Diagrams are actively used to illustrate simple set relationships in set theory and probability theory, logic and statistics, mathematics and computer science, linguistics, sociology, and marketing. Venn Diagrams are also often used to visually summarize the status and future viability of a project.
 Cisco Network Diagrams
Cisco Network Diagrams solution extends ConceptDraw DIAGRAM with the best characteristics of network diagramming software. Included samples, templates and libraries of built-in standardized vector Cisco network icons and Cisco symbols of computers, network devices, network appliances and other Cisco network equipment will help network engineers, network designers, network and system administrators, as well as other IT professionals and corporate IT departments to diagram efficiently the network infrastructure, to visualize computer networks topologies, to design Cisco computer networks, and to create professional-looking Cisco Computer network diagrams, Cisco network designs and schematics, Network maps, and Network topology diagrams in minutes.
 Presentation Clipart
Presentation design elements solution extends ConceptDraw DIAGRAM software with slide samples, templates and vector stencils libraries with design elements of presentation symbols, arrows, callouts, backgrounds, borders and frames, title blocks.
 Interactive Voice Response Diagrams
Interactive Voice Response Diagrams solution extends ConceptDraw DIAGRAM software with samples, templates and libraries of ready-to-use vector stencils that help create Interactive Voice Response (IVR) diagrams illustrating in details a work of interactive voice response system, the IVR system’s logical and physical structure, Voice-over-Internet Protocol (VoIP) diagrams, and Action VoIP diagrams with representing voice actions on them, to visualize how the computers interact with callers through voice recognition and dual-tone multi-frequency signaling (DTMF) keypad inputs.
- HVAC Business Plan | Online Collaboration via Skype | HVAC Plans ...
- Draw Company Structure with Organization Charting Software | How ...
- HVAC Business Plan | Online Collaboration via Skype | How to ...
- Draw Company Structure with Organization Charting Software ...
- Banquet Hall Plan Software
- How To Draw Business Plan
- Organizational Charts | How To Create Restaurant Floor Plan in ...
- Make Your Own Floor Plans | Cafe and Restaurant Floor Plans ...
- Office Layout Plans | Cafe and Restaurant Floor Plans | Network ...
- How To Create Restaurant Floor Plan in Minutes | Simple ...
- Blank Calendar Template | Blank Calendar | Economic Calendar ...
- Banquet Hall Plan Software | Business diagrams & Org Charts with ...
- Hotel Network Topology Diagram | Draw Company Structure with ...
- Organizational Chart Of Cafe And Restaurant
- Draw Company Structure with Organization Charting Software ...
- Design Finance Plan
- Banquet Hall Plan Software | Banquet hall plan | Restaurant Floor ...
- Cafe and Restaurant Floor Plan | How to Design a Restaurant Floor ...
- Basic Diagramming | Scatter Graph | How To Create Restaurant ...
- How To Create Restaurant Floor Plan in Minutes | How To Draw ...