HelpDesk
How to Create a Fault Tree Analysis Diagram (FTD) in ConceptDraw PRO

"Failure analysis is the process of collecting and analyzing data to determine the cause of a failure. It is an important discipline in many branches of manufacturing industry, such as the electronics industry, where it is a vital tool used in the development of new products and for the improvement of existing products. There are many companies which provide services to find the cause of failure in products, devices and in post disaster situations. The failure analysis process relies on collecting failed components for subsequent examination of the cause or causes of failure using a wide array of methods, especially microscopy and spectroscopy. The NDT or nondestructive testing methods (such as Industrial computed tomography scanning) are valuable because the failed products are unaffected by analysis, so inspection always starts using these methods." [Failure analysis. Wikipedia]
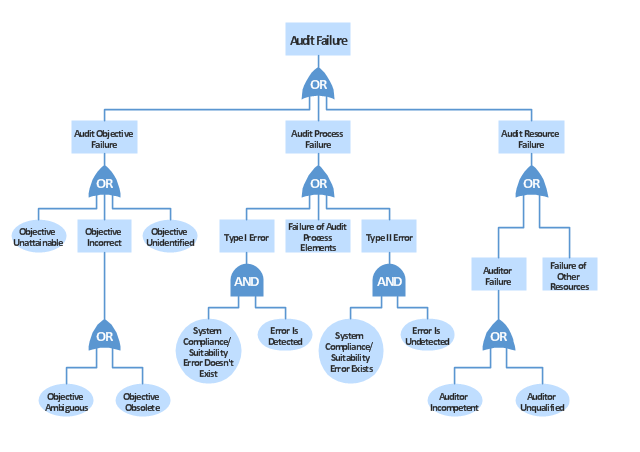
The example "Audit failure - Fault tree analysis diagram" was created using the ConceptDraw PRO diagramming and vector drawing software extended with the Fault Tree Analysis Diagrams solution from the Engineering area of ConceptDraw Solution Park.
The example "Audit failure - Fault tree analysis diagram" was created using the ConceptDraw PRO diagramming and vector drawing software extended with the Fault Tree Analysis Diagrams solution from the Engineering area of ConceptDraw Solution Park.
FTA diagram
 Fault Tree Analysis Diagrams
This solution extends ConceptDraw PRO v9.5 or later with templates, fault tree analysis example, samples and a library of vector design elements for drawing FTA diagrams (or negative analytical trees), cause and effect diagrams and fault tree diagrams.
Fault Tree Analysis Example

Fault Tree Analysis Software

Fault Tree Diagram

 ConceptDraw Solution Park
ConceptDraw Solution Park collects graphic extensions, examples and learning materials
Graphics Software for Business
 diagram")
Marketing Charts

Process Flowchart


 SWOT and TOWS Matrix Diagrams
SWOT and TOWS Matrix Diagrams solution extends ConceptDraw PRO and ConceptDraw MINDMAP software with features, templates, samples and libraries of vector stencils for drawing SWOT and TOWS analysis matrices and mind maps.
HelpDesk
How to Create a SDL Diagram
 diagram")
How to Design Landscape

- Fault Tree Analysis Diagrams
- Audit failure - Fault tree analysis diagram | Design elements - Fault ...
- Product Failure Fish Born Diagram
- How to Create a Fault Tree Analysis Diagram (FTD) in ConceptDraw ...
- Fault Tree Analysis Diagrams
- Fault Tree Analysis Exa
- Fault Tree Analysis Software
- Fault Tree Analysis Software | Star Network Topology | Total Quality ...
- Fault Tree Analysis Examples
- Fault Tree Analysis Software | Design elements - Fault tree analysis ...
- FTA diagram - Hazard analysis | Accident analytic tree - FTA ...
- Fault Tree Analysis Diagrams | Tree Network Topology Diagram ...
- Design elements - Fault tree analysis diagrams | Audit failure - Fault ...
- Audit failure - Fault tree analysis diagram | Tree Diagram Of Gate ...
- Audit failure - Fault tree analysis diagram | Audit Flowcharts ...
- PROBLEM ANALYSIS . Root Cause Analysis Tree Diagram | Fault ...
- Fault Tree Analysis Diagrams | PROBLEM ANALYSIS. Root Cause ...
- SWOT Analysis | Fault Tree Analysis Example | Garrett IA Diagrams ...
- Tree Network Topology Diagram | Fault Tree Analysis Diagrams ...
- Fault Tree Analysis Software | Process Flowchart | Process and ...