"Failure analysis is the process of collecting and analyzing data to determine the cause of a failure. It is an important discipline in many branches of manufacturing industry, such as the electronics industry, where it is a vital tool used in the development of new products and for the improvement of existing products. There are many companies which provide services to find the cause of failure in products, devices and in post disaster situations. The failure analysis process relies on collecting failed components for subsequent examination of the cause or causes of failure using a wide array of methods, especially microscopy and spectroscopy. The NDT or nondestructive testing methods (such as Industrial computed tomography scanning) are valuable because the failed products are unaffected by analysis, so inspection always starts using these methods." [Failure analysis. Wikipedia]
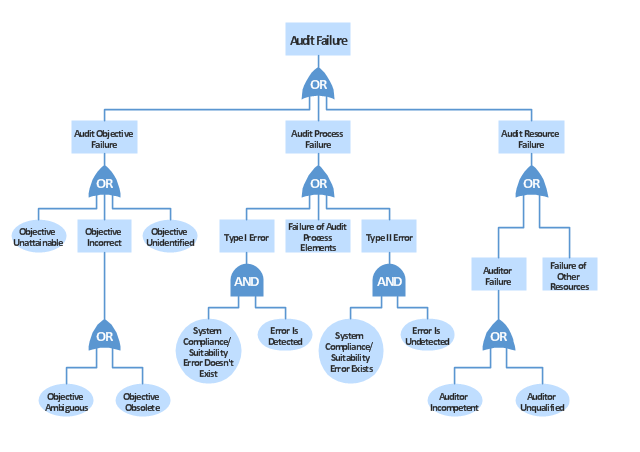
The example "Audit failure - Fault tree analysis diagram" was created using the ConceptDraw PRO diagramming and vector drawing software extended with the Fault Tree Analysis Diagrams solution from the Engineering area of ConceptDraw Solution Park.
The example "Audit failure - Fault tree analysis diagram" was created using the ConceptDraw PRO diagramming and vector drawing software extended with the Fault Tree Analysis Diagrams solution from the Engineering area of ConceptDraw Solution Park.
FTA diagram
The vector stencils library "Fault tree analysis diagrams" contains 12 symbols for drawing Fault Tree Analysis (FTA) diagrams.
"Fault tree analysis (FTA) is a top down, deductive failure analysis in which an undesired state of a system is analyzed using Boolean logic to combine a series of lower-level events. This analysis method is mainly used in the fields of safety engineering and reliability engineering to understand how systems can fail, to identify the best ways to reduce risk or to determine (or get a feeling for) event rates of a safety accident or a particular system level (functional) failure. FTA is used in the aerospace, nuclear power, chemical and process, pharmaceutical, petrochemical and other high-hazard industries; but is also used in fields as diverse as risk factor identification relating to social service system failure.
In aerospace, the more general term "system Failure Condition" is used for the "undesired state" / Top event of the fault tree. These conditions are classified by the severity of their effects. The most severe conditions require the most extensive fault tree analysis. These "system Failure Conditions" and their classification are often previously determined in the functional Hazard analysis." [Fault tree analysis. Wikipedia]
The shapes example "Fault tree analysis diagrams" was created using the ConceptDraw PRO diagramming and vector drawing software extended with the Fault Tree Analysis Diagrams solution from the Engineering area of ConceptDraw Solution Park.
FTA diagram symbols

The FTA diagram sample "Fault tree analysis - Insulin delivery system" was redesigned from the illustration of "CMSI 641: Introduction to Software Engineering. Design of Critical Systems. B.J. Johnson. 2005. Loyola Marymount University".
"Another way of assessing hazards is using fault tree analysis. In this process, each of the identified hazards is covered by a detailed analysis to find out what might cause it. Either inductive or deductive reasoning is applied. In the case of software hazards, the usual focus is to determine faults that will cause the system to fail to deliver a system service, such as a monitoring system. A "fault tree" is constructed to link all the possible situations together, to help identify the interrelationships of the failures, which modules may cause them, and what "trickle-down effects" there might be. Here is an example of a fault tree, as applied to the Insulin delivery system from Sommerville...
Note that this tree is only partially complete, since only the potential software faults are shown on the diagram. The potential failures involving hardware, such as low battery, blood monitor or sensor failure, patient over-exertion or inattention, or medical staff failure are noticeable by their absence.
The fault tree and safety specification processes are two ways of helping with system risk assessment tasks. Once the risks are identified, there are other assessments that need to take place. First, the likelihood of the risk occurrance must be assessed. This is often quantifiable, so numbers may be assigned based on things like MTBF, latency effects, and other known entities. There may be other non-quantifiable contributors to the risk likelihood, however, such that these must be assessed and estimated by experts in the domain. (Don't short-change this process when dealing with critical systems!) Finally, the risk assessment must include the severity of the risk, meaning an estimation of the cost to the project in the event the risk item actually does occur. "Cost to the project" means all associated costs, including schedule delays, human injury, damage to hardware, corruption of data, and so on."
[myweb.lmu.edu/ bjohnson/ cmsi641web/ week15-2.html]
The FTA diagram example "Fault tree analysis - Insulin delivery system" was created using the ConceptDraw PRO diagramming and vector drawing software extended with the Fault Tree Analysis Diagrams solution from the Engineering area of ConceptDraw Solution Park.
FTA diagram

 ConceptDraw Solution Park
ConceptDraw Solution Park collects graphic extensions, examples and learning materials
 Project Exchange
This solution extends ConceptDraw PROJECT and ConceptDraw MINDMAP software with the ability to import and export project data.
 Collaboration Area
The solutions from Collaboration area of ConceptDraw Solution Park extend ConceptDraw PRO and ConceptDraw MINDMAP software with features, samples, templates and vector stencils libraries for drawing diagrams and mindmaps useful for collaboration.
 Computer and Networks Area
The solutions from Computer and Networks Area of ConceptDraw Solution Park collect samples, templates and vector stencils libraries for drawing computer and network diagrams, schemes and technical drawings.
- Audit failure - Fault tree analysis diagram | Design elements - Fault ...
- Fault Tree Analysis Diagrams | Root cause analysis tree diagram ...
- Design elements - Fault tree analysis diagrams | Audit failure - Fault ...
- Draw Fault Tree Analysis Online
- Fault Tree Analysis Diagrams | Audit failure - Fault tree analysis ...
- Accident analytic tree - FTA diagram | FTA diagram - Hazard ...
- FTA diagram - Hazard analysis | Design elements - Fault tree ...
- Audit failure - Fault tree analysis diagram | Tree Diagram Of Gate ...
- Fault Tree Analysis Diagrams | Design elements - Fault tree analysis ...
- Cause Tree Analysis Method
- Audit failure - Fault tree analysis diagram | Star Network Topology ...
- Audit failure - Fault tree analysis diagram | Audit Flowcharts ...
- Audit failure - Fault tree analysis diagram | Comparing ConceptDraw ...
- Fault Tree Analysis Software | Fault Tree Analysis Diagrams | Fault ...
- Fault Tree Analysis Software | Design elements - Fault tree analysis ...
- Fault Tree Analysis Software | Star Network Topology | Total Quality ...
- Fault Tree Analysis Software
- Safety Fault Tree Analysis Example
- How to Create a Fault Tree Analysis Diagram (FTD) in ConceptDraw ...