HelpDesk
How to Create a Sales Dashboard

HelpDesk
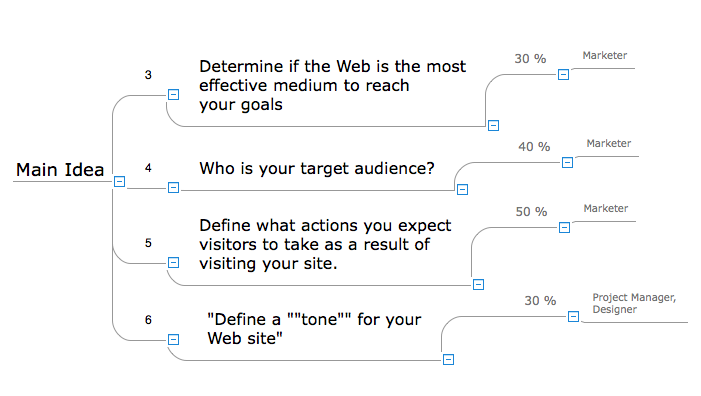
How to Input Data from MS Excel Into a Mind Map
Context Diagram Template

This template shows the Context Diagram. It was created in ConceptDraw DIAGRAM diagramming and vector drawing software using the Block Diagrams Solution from the “Diagrams” area of ConceptDraw Solution Park. The context diagram graphically identifies the system. external factors, and relations between them. It’s a high level view of the system. The context diagrams are widely used in software engineering and systems engineering for designing the systems that process the information.
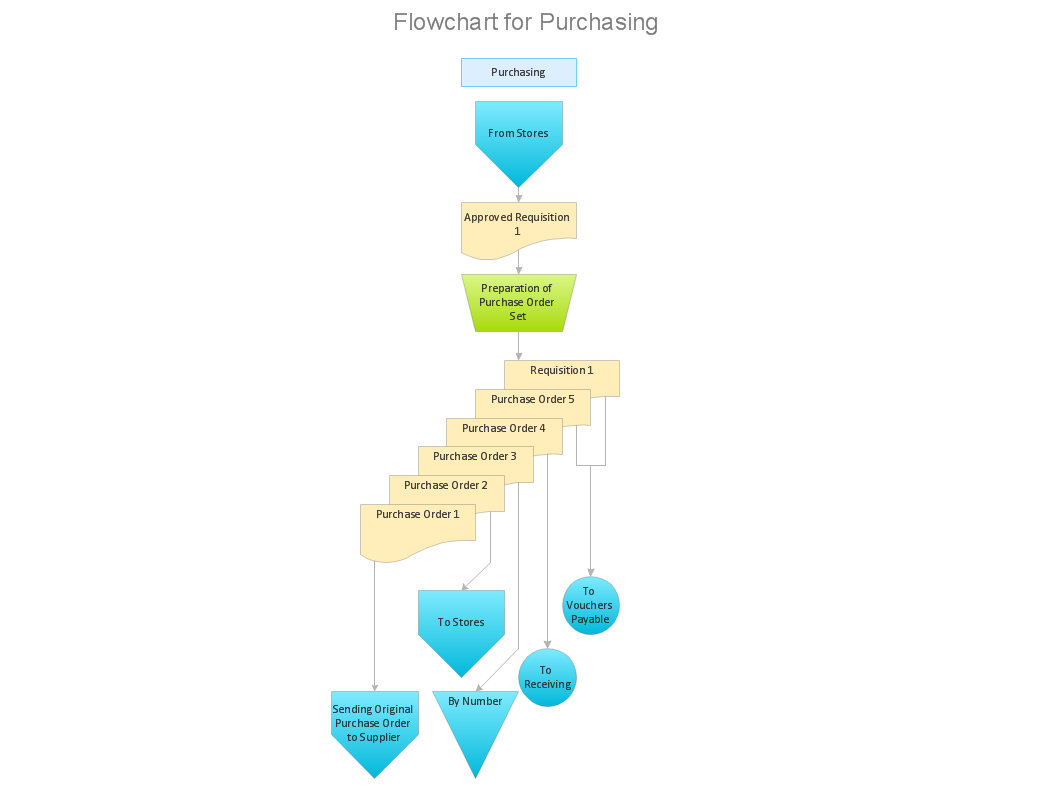
How Do You Make An Accounting Process Flowchart?
"In computer networks, networked computing devices pass data to each other along data connections. The connections (network links) between nodes are established using either cable media or wireless media. ...
Network computer devices that originate, route and terminate the data are called network nodes. Nodes can include hosts such as personal computers, phones, servers as well as networking hardware. ...
Network links.
The communication media used to link devices to form a computer network include electrical cable (HomePNA, power line communication, G.hn), optical fiber (fiber-optic communication), and radio waves (wireless networking). In the OSI model, these are defined at layers 1 and 2 - the physical layer and the data link layer.
A widely adopted family of communication media used in local area network (LAN) technology is collectively known as Ethernet. The media and protocol standards that enable communication between networked devices over Ethernet are defined by IEEE 802.3. Ethernet transmit data over both copper and fiber cables. Wireless LAN standards (e.g. those defined by IEEE 802.11) use radio waves, or others use infrared signals as a transmission medium. Power line communication uses a building's power cabling to transmit data. ...
Network nodes.
Apart from the physical communications media described above, networks comprise additional basic system building blocks, such as network interface controller (NICs), repeaters, hubs, bridges, switches, routers, modems, and firewalls." [Computer network. Wikipedia]
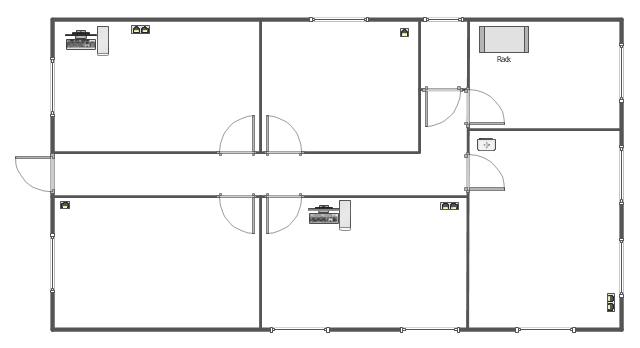
The network equipment and cabling layout floorplan template for the ConceptDraw PRO diagramming and vector drawing software is included in the Network Layout Floor Plans solution from the Computer and Networks area of ConceptDraw Solution Park.
Network computer devices that originate, route and terminate the data are called network nodes. Nodes can include hosts such as personal computers, phones, servers as well as networking hardware. ...
Network links.
The communication media used to link devices to form a computer network include electrical cable (HomePNA, power line communication, G.hn), optical fiber (fiber-optic communication), and radio waves (wireless networking). In the OSI model, these are defined at layers 1 and 2 - the physical layer and the data link layer.
A widely adopted family of communication media used in local area network (LAN) technology is collectively known as Ethernet. The media and protocol standards that enable communication between networked devices over Ethernet are defined by IEEE 802.3. Ethernet transmit data over both copper and fiber cables. Wireless LAN standards (e.g. those defined by IEEE 802.11) use radio waves, or others use infrared signals as a transmission medium. Power line communication uses a building's power cabling to transmit data. ...
Network nodes.
Apart from the physical communications media described above, networks comprise additional basic system building blocks, such as network interface controller (NICs), repeaters, hubs, bridges, switches, routers, modems, and firewalls." [Computer network. Wikipedia]
The network equipment and cabling layout floorplan template for the ConceptDraw PRO diagramming and vector drawing software is included in the Network Layout Floor Plans solution from the Computer and Networks area of ConceptDraw Solution Park.
LAN equipment and cabling layout floorplan template
Stakeholder Onion Diagram Template

"Causes in the diagram are often categorized, such as to the 6 M's ...
The 6 Ms (used in manufacturing industry):
(1) Machine (technology);
(2) Method (process);
(3) Material (Includes Raw Material, Consumables and Information.);
(4) Man Power (physical work)/ Mind Power (brain work): Kaizens, Suggestions;
(5) Measurement (Inspection);
(6) Milieu/ Mother Nature (Environment).
The original 6Ms used by the Toyota Production System have been expanded by some to include the following and are referred to as the 8Ms. However, this is not globally recognized. It has been suggested to return to the roots of the tools and to keep the teaching simple while recognizing the original intent; most programs do not address the 8Ms.
(7) Management/ Money Power;
(8) Maintenance." [Ishikawa diagram. Wikipedia]
This 8Ms Ishikawa diagram (manufacturing cause and effect diagram) template is included in the Fishbone Diagram solution from the Management area of ConceptDraw Solution Park.
8Ms Ishikawa diagram

"Process Decision Program Chart (PDPC).
A useful way of planning is to break down tasks into a hierarchy, using a tree diagram. The PDPC extends the tree diagram a couple of levels to identify risks and countermeasures for the bottom level tasks. Different shaped boxes are used to highlight risks and identify possible countermeasures (often shown as 'clouds' to indicate their uncertain nature). The PDPC is similar to the Failure Modes and Effects Analysis (FMEA) in that both identify risks, consequences of failure, and contingency actions; the FMEA also rates relative risk levels for each potential failure point." [Seven Management and Planning Tools. Wikipedia]
The Risk diagram (process decision program chart, PDPC) determines the risks when corrective action is not performed correctly. Also, it helps develop descriptions for preventive actions at the level of execution.
The Risk diagram (PDPC) template for the ConceptDraw PRO diagramming and vector drawing software is included in the solution "Seven Management and Planning Tools" from the Management area of ConceptDraw Solution Park.
Risk diagram
---template.png--diagram-flowchart-example.png)
HelpDesk
How to Import Project Data From MS Excel File

HelpDesk
How to Start Mind Mapping from a Custom Template

Cross-Functional Flowchart (Swim Lanes)

Flowchart Software


HelpDesk
How to Convert a Mind Map into MS Word Document

- Free Kanban Board Excel Template
- Recruiting Metrics Excel Template
- Kpi Dashboard Excel Template Free Download
- Vsm Excel Template
- Competitor Analysis | Performance Scorecard Template Excel Free
- Balanced Scorecard Template Excel
- KPI Dashboard | What is a KPI? | Dashboard | Free Kpi Template Excel
- Kanban Board Excel Template Download
- Vsm Template Excel
- Seating Plans | House Of Quality Excel Template Free
- Balanced Scorecard Excel Template
- Pert Chart Excel Template
- Kanban Excel Template Free
- Excel Safety Scorecard Template
- Aon Diagram Excel Template
- Driver Diagram Templates Excel
- Ishikawa Diagram Excel Template
- Planogram Excel Template
- Kanban Board Template Excel
- Free Scorecard Template Excel