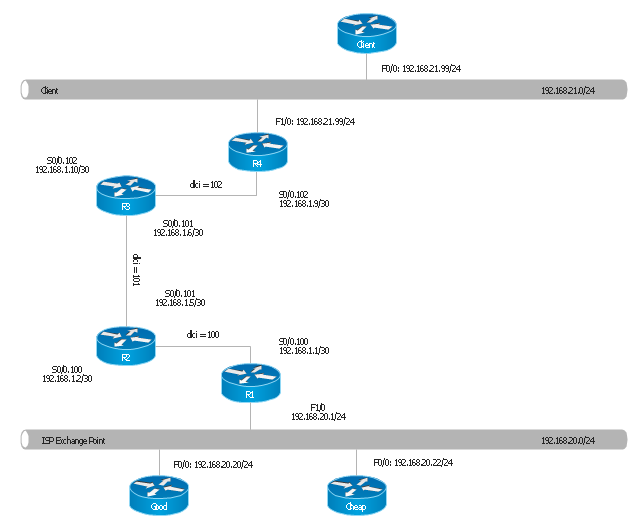
"Logical topology, or signal topology, is the arrangement of devices on a computer network and how they communicate with one another. How devices are connected to the network through the actual cables that transmit data, or the physical structure of the network, is called the physical topology. Physical topology defines how the systems are physically connected. It represents the physical layout of the devices on the network. The logical topology defines how the systems communicate across the physical topologies.
Logical topologies are bound to network protocols and describe how data is moved across the network. ...
EXAMPLE : twisted pair Ethernet is a logical bus topology in a physical star topology layout. while IBM's token ring is a logical ring topology, it is physically set up in star topology." [Logical topology. Wikipedia]
This Cisco logical computer network diagram example was created using the ConceptDraw PRO diagramming and vector drawing software extended with the Cisco Network Diagrams solution from the Computer and Networks area of ConceptDraw Solution Park.
Logical network topology diagram
This HVAC floor plan sample shows the ventilation duct system layout.
"Ducts are used in heating, ventilation, and air conditioning (HVAC) to deliver and remove air. The needed airflows include, for example, supply air, return air, and exhaust air. Ducts commonly also deliver ventilation air as part of the supply air. As such, air ducts are one method of ensuring acceptable indoor air quality as well as thermal comfort.
A duct system is also called ductwork. Planning (laying out), sizing, optimizing, detailing, and finding the pressure losses through a duct system is called duct design." [Duct (flow). Wikipedia]
The HVAC floor plan example "Ductwork layout" was created using the ConceptDraw DIAGRAM diagramming and vector drawing software extended with the HVAC Plans solution from the Building Plans area of ConceptDraw Solution Park.
HVAC floor plan

The vector stencils library "Weather" contains 17 weather clipart images for drawing illustrations on climate to show cloudiness, air temperature, precipitation, wind.
"Weather is the state of the atmosphere, to the degree that it is hot or cold, wet or dry, calm or stormy, clear or cloudy. Most weather phenomena occur in the troposphere, just below the stratosphere. Weather generally refers to day-to-day temperature and precipitation activity, whereas climate is the term for the average atmospheric conditions over longer periods of time. When used without qualification, "weather", is generally understood to mean the weather of Earth.
Weather is driven by air pressure (temperature and moisture) differences between one place and another. These pressure and temperature differences can occur due to the sun angle at any particular spot, which varies by latitude from the tropics. The strong temperature contrast between polar and tropical air gives rise to the jet stream. Weather systems in the mid-latitudes, such as extratropical cyclones, are caused by instabilities of the jet stream flow. Because the Earth's axis is tilted relative to its orbital plane, sunlight is incident at different angles at different times of the year. On Earth's surface, temperatures usually range ±40°C (−40°F to 100°F) annually. Over thousands of years, changes in Earth's orbit affect the amount and distribution of solar energy received by the Earth and influence long-term climate and global climate change." [Weather. Wikipedia]
The clip art example "Weather - Vector stencils library" was created using the ConceptDraw PRO diagramming and vector drawing software extended with the Nature solution from the Illustration area of ConceptDraw Solution Park.
www.conceptdraw.com/ solution-park/ illustrations-nature
Sunny

Cloudy

Overcast

Snow

Rain

Lightning

Hot

Warm

Frost

Mist

Strong wind

Flood

Tsunami

Dew

Hoar-frost

Earthquake

Snowflake

The vector stencils library "Composition charts" contains 6 templates: 2 pie charts, 2 divided bar charts and 2 double divided bar charts.
The vector stencils library "Composition indicators" contains 6 templates of visual indicators.
Use these design elements to visualize composition comparison of your data in your visual dashboard created using the ConceptDraw PRO diagramming and vector drawing software.
"A pie chart (or a circle graph) is a circular chart divided into sectors, illustrating numerical proportion. In a pie chart, the arc length of each sector (and consequently its central angle and area), is proportional to the quantity it represents. While it is named for its resemblance to a pie which has been sliced, there are variations on the way it can be presented. ...
An obvious flaw exhibited by pie charts is that they cannot show more than a few values without separating the visual encoding (the “slices”) from the data they represent (typically percentages). When slices become too small, pie charts have to rely on colors, textures or arrows so the reader can understand them. This makes them unsuitable for use with larger amounts of data. Pie charts also take up a larger amount of space on the page compared to the more flexible alternative of bar charts, which do not need to have separate legends, and can also display other values such as averages or targets at the same time. ...
Most subjects have difficulty ordering the slices in the pie chart by size; when the bar chart is used the comparison is much easier. Similarly, comparisons between data sets are easier using the bar chart. However, if the goal is to compare a given category (a slice of the pie) with the total (the whole pie) in a single chart and the multiple is close to 25 or 50 percent, then a pie chart can often be more effective than a bar graph." [Pie chart. Wikipedia]
The example "Design elements - Composition charts and indicators" is included in the Composition Dashboard solution from the area "What is a Dashboard" of ConceptDraw Solution Park.
Composition charts and visual indicators

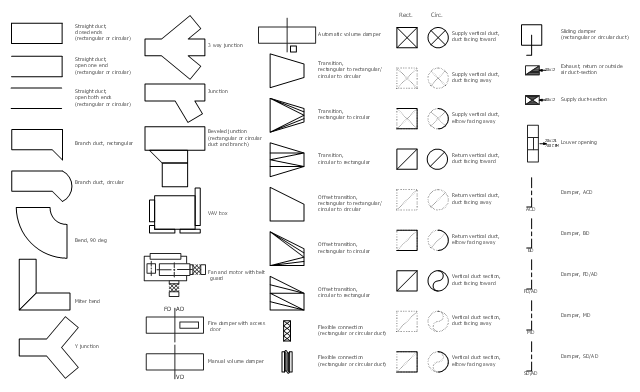
The vector stencil library "HVAC ductwork" contains 63 duct and vent symbols.
Use it for drawing HVAC system diagrams, heating, ventilation, air conditioning, refrigeration, automated building control, and environmental control design floor
plans and equipment layouts.
"Ducts are used in heating, ventilation, and air conditioning (HVAC) to deliver and remove air. These needed airflows include, for example, supply air, return air, and exhaust air. Ducts also deliver, most commonly as part of the supply air, ventilation air. As such, air ducts are one method of ensuring acceptable indoor air quality as well as thermal comfort.
A duct system is often called ductwork. Planning ('laying out'), sizing, optimizing, detailing, and finding the pressure losses through a duct system is called duct design." [Duct (HVAC). Wikipedia]
The vector stencils example "Design elements - HVAC ductwork" is included in HVAC Plans solution from the Building Plans area of ConceptDraw Solution Park.
HVAC ductwork symbols
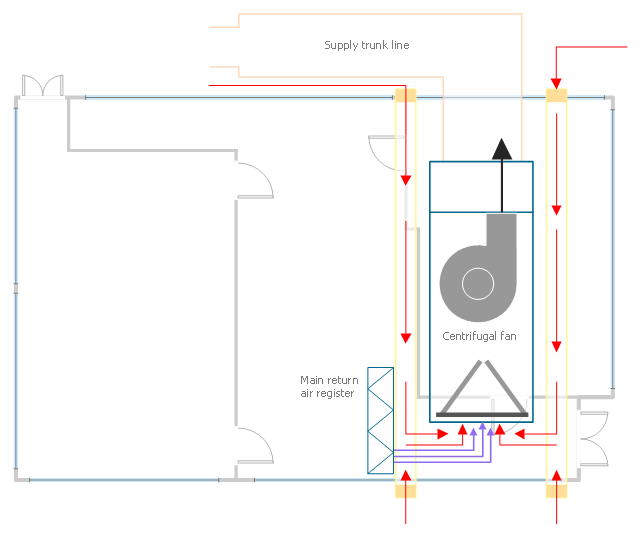
This HVAC plan sample shows the air handler layout on the floor plan.
"An air handler, or air handling unit (often abbreviated to AHU), is a device used to condition and circulate air as part of a heating, ventilating, and air-conditioning (HVAC) system. An air handler is usually a large metal box containing a blower, heating or cooling elements, filter racks or chambers, sound attenuators, and dampers. Air handlers usually connect to a ductwork ventilation system that distributes the conditioned air through the building and returns it to the AHU. Sometimes AHUs discharge (supply) and admit (return) air directly to and from the space served without ductwork.
Small air handlers, for local use, are called terminal units, and may only include an air filter, coil, and blower; these simple terminal units are called blower coils or fan coil units. A larger air handler that conditions 100% outside air, and no recirculated air, is known as a makeup air unit (MAU). An air handler designed for outdoor use, typically on roofs, is known as a packaged unit (PU) or rooftop unit (RTU)." [Air handler. Wikipedia]
The floor plan example "Air handler - HVAC plan" was created using the ConceptDraw DIAGRAM diagramming and vector drawing software extended with the HVAC Plans solution from the Building Plans area of ConceptDraw Solution Park.
Floor plan