 Divided Bar Diagrams
The Divided Bar Diagrams Solution extends the capabilities of ConceptDraw DIAGRAM with templates, samples, and a library of vector stencils for drawing high impact and professional Divided Bar Diagrams and Graphs, Bar Diagram Math, and Stacked Graph.
HelpDesk
How to Draw a Divided Bar Chart

 Basic Divided Bar Diagrams
This solution extends the capabilities of ConceptDraw DIAGRAM with templates, samples and a library of vector stencils for drawing Divided Bar diagrams.
Bar Diagram Math

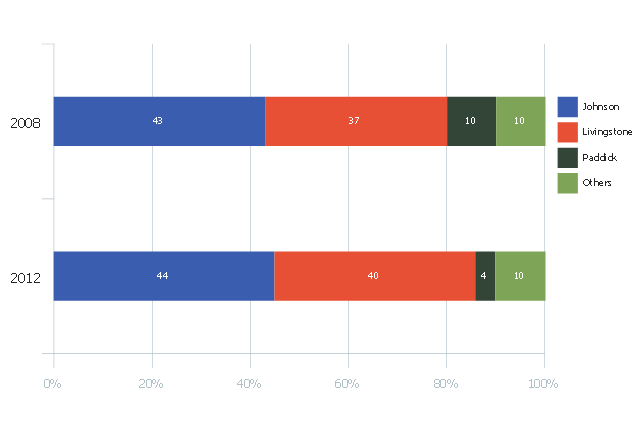
This divided bar diagram sample shows London election results in 2008 and 2012. It was drawn using data from the infographics "London Elections Results by Numbers" on the london.gov.uk website.
[data.london.gov.uk/ datastore/ package/ london-elections-results-2012-wards-boroughs-constituency]
"There are six types of elections in the United Kingdom: United Kingdom general elections, elections to devolved parliaments and assemblies, elections to the European Parliament, local elections, mayoral elections and Police and Crime Commissioner elections. Elections are held on Election Day, which is conventionally a Thursday. General elections do not have fixed dates, but must be called within five years of the opening of parliament following the last election. Other elections are held on fixed dates, though in the case of the devolved assemblies and parliaments early elections can occur in certain situations. Currently, six electoral systems are used: the single member plurality system (First Past the Post), the multi member plurality system, party list PR, the single transferable vote, the Additional Member System and the Supplementary Vote.
Elections are administered locally: in each lower-tier local authority, the actual polling procedure is run by the Returning Officer and the compiling and maintenance of the electoral roll by the Electoral Registration Officer (except in Northern Ireland, where the Electoral Office for Northern Ireland assumes both responsibilities). The Electoral Commission only sets standards for and issues guidelines to Returning Officers and Electoral Registration Officers, but is responsible for nationwide electoral administration (such as the registration of political parties and directing the administration of national referendums)." [Elections in the United Kingdom. Wikipedia]
The chart example "London election results" was created using the ConceptDraw PRO diagramming and vector drawing software extended with the Divided Bar Diagrams solution from the Graphs and Charts area of ConceptDraw Solution Park.
Divided bar chart
Stacked Graph

Bar Chart

Chart Maker for Presentations

 Bar Graphs
The Bar Graphs solution enhances ConceptDraw DIAGRAM functionality with templates, numerous professional-looking samples, and a library of vector stencils for drawing different types of Bar Graphs, such as Simple Bar Graph, Double Bar Graph, Divided Bar Graph, Horizontal Bar Graph, Vertical Bar Graph, and Column Bar Chart.
Chart Software for Better Presentations

Relative Value Chart Software

Basic Diagramming


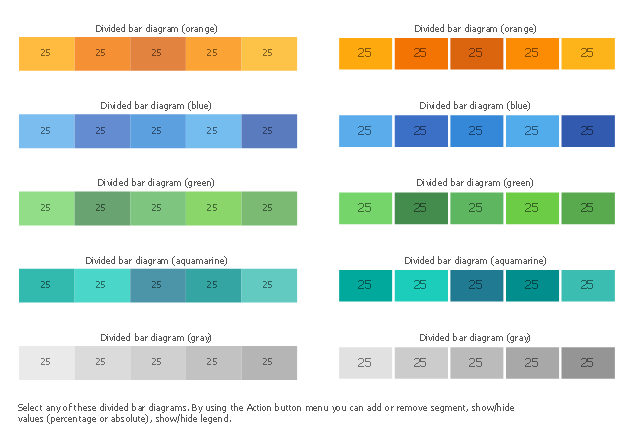
The vector stencils library "Divided bar diagrams" contains 10 chart templates. Use it to draw your divided bar charts in the ConceptDraw PRO diagramming and vector drawing software.
A divided bar graph is a horizontal bar divided into segments to illustrate numerical proportion. Each segment length represents the percentage of the part in the 100% total amount.
The chart templates example "Design elements - Divided bar diagrams"
is included in the Basic Divided Bar Diagrams solution from the Graphs and Charts area of ConceptDraw Solution Park.
Chart templates
The Best Drawing Program for Mac

The vector stencils library "Data-driven charts" contains 13 data-driven graphs and charts: area chart, divided bar diagram, double bar graph, frequency histogram, horizontal bar chart, line graph, percentage ring chart, percentage pie chart, scatter plot, column chart, waterfall chart.
Use it to visualize quantitative data in your data-driven infographics.
The graphs example "Data-driven charts - Vector stencils library" was created using the ConceptDraw PRO diagramming and vector graphics software extended with the Data-driven Infographics solution from the area "What is infographics" of ConceptDraw Solution Park.
Area chart

Divided bar diagram

Double bar graph

Frequency histogram

Horizontal bar graph

Line graph

Percentage ring chart

Pie chart

Percentage pie chart

Ring chart

Scatter plot

Column chart (vertical bar graph)
-data-driven-charts---vector-stencils-library.png--diagram-flowchart-example.png)
Waterfall chart

Pie Donut Chart. Pie Chart Examples

 Business Diagrams Package
Business Diagrams Package is a large set of comprehensive graphical solutions from the ConceptDraw Solution Park, which are powerful in solving the business, marketing and quality tasks in completely different fields, such as finance, education, health food and cooking, HR, and many others. The tools of this package's solutions are a powerful assistant in drawing all diversity of Financial and Marketing infographics, Business process workflow diagrams, Organizational charts, Education infographics, Quality diagrams, Health food diagrams, HR flowcharts, as well as different graphics and charts, which depict the values of key business indicators, their dependencies, give the full understanding of a situation within a company and on the market.
 Basic Bar Graphs
This solution enhances ConceptDraw DIAGRAM (or later) with templates, samples and a library of vector stencils for drawing Bar Graphs.
 Education Package
Education Package is a comprehensive set of multifarious graphical solutions from ConceptDraw Solution Park, collected together in help to ConceptDraw DIAGRAM users working in a field of science, education and training, which is aimed at improving the quality of education and helping to design with ease variety of interesting and colorful educational materials, diagrams, charts and maps. Use it to present the information and knowledge in an interesting, clear, structured and simple form to achieve a success in education and pedagogy, to maintain the interest of students and pupils throughout the whole learning process, at the lectures, lessons and even during independent work with additional materials, to contribute to better perception of scientific information by listeners during the conferences and reports.
What Is a Picture Graph?

- Diagramatic Of Divided Bar Graph
- Divided Bar Diagrams | How to Draw a Divided Bar Chart in ...
- How to Draw a Divided Bar Chart | Bar Chart | Column Chart ...
- How to Draw a Divided Bar Chart in ConceptDraw PRO | Sales ...
- How to Draw a Divided Bar Chart | Divided Bar Diagrams | Divided ...
- How to Draw a Divided Bar Chart in ConceptDraw PRO | Steps ...
- Financial Comparison Chart | Bar Diagrams for Problem Solving ...
- How to Draw a Divided Bar Chart in ConceptDraw PRO | UK Map ...
- How to Draw a Divided Bar Chart in ConceptDraw PRO | Basic ...
- Divided bar diagram - Template
- Bar Diagram Math | Divided Bar Diagrams | Double bar graph ...
- Pie Graph Worksheets | How to Draw a Divided Bar Chart in ...
- How to Draw a Divided Bar Chart in ConceptDraw PRO | Bar ...
- Bar Graphs | Divided Bar Diagrams | How to Draw a Divided Bar ...
- How to Draw a Divided Bar Chart in ConceptDraw PRO | Divided ...
- Divided bar diagram - Template
- How to Draw a Divided Bar Chart in ConceptDraw PRO | Process ...
- Electrical Engineering | Bar Graphs | Divided Bar Diagrams | Bar ...
- Sales Growth. Bar Graphs Example | Bar Diagrams for Problem ...
- Bar Graphs | Bar Graph | Double bar graph - Template | _bar Graph_