 Interactive Voice Response Diagrams
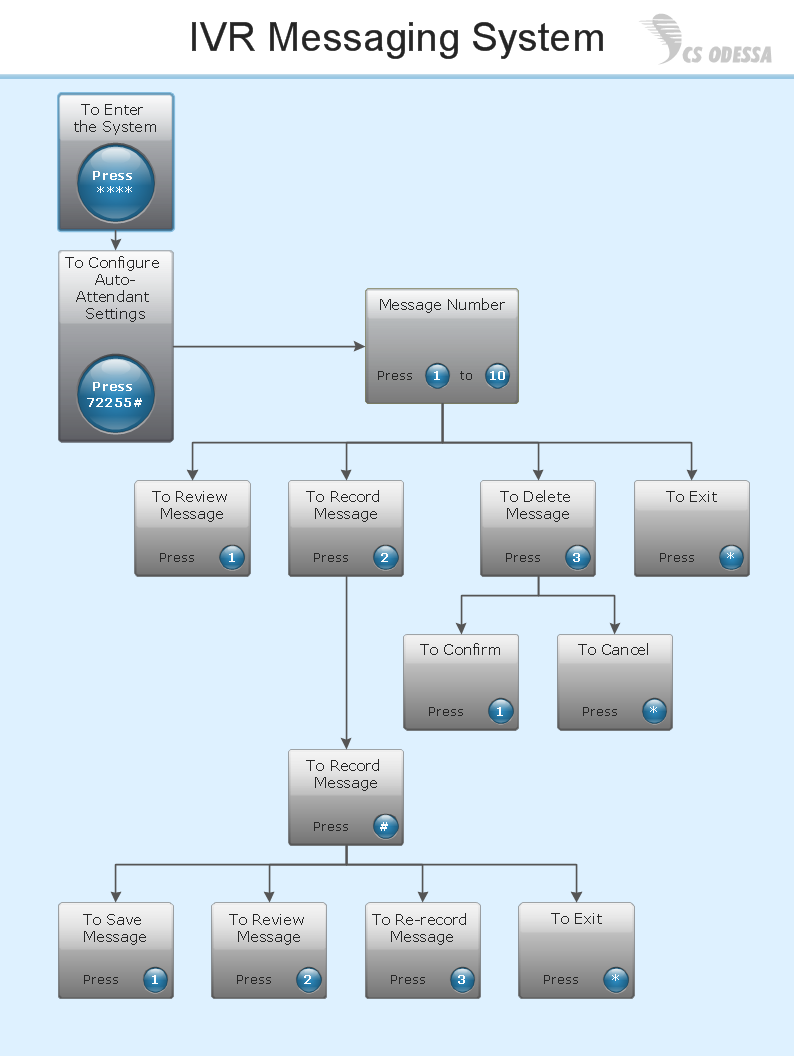
Interactive Voice Response Diagrams solution extends ConceptDraw DIAGRAM software with samples, templates and libraries of ready-to-use vector stencils that help create Interactive Voice Response (IVR) diagrams illustrating in details a work of interactive voice response system, the IVR system’s logical and physical structure, Voice-over-Internet Protocol (VoIP) diagrams, and Action VoIP diagrams with representing voice actions on them, to visualize how the computers interact with callers through voice recognition and dual-tone multi-frequency signaling (DTMF) keypad inputs.
Network Diagram Examples
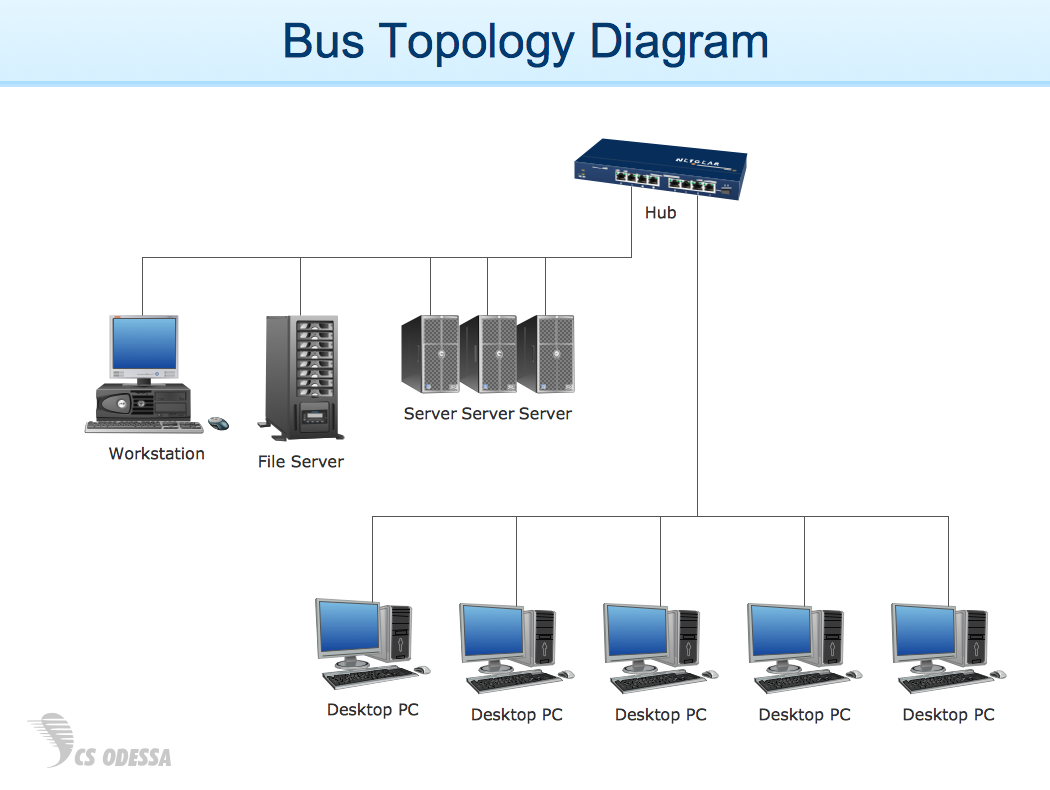
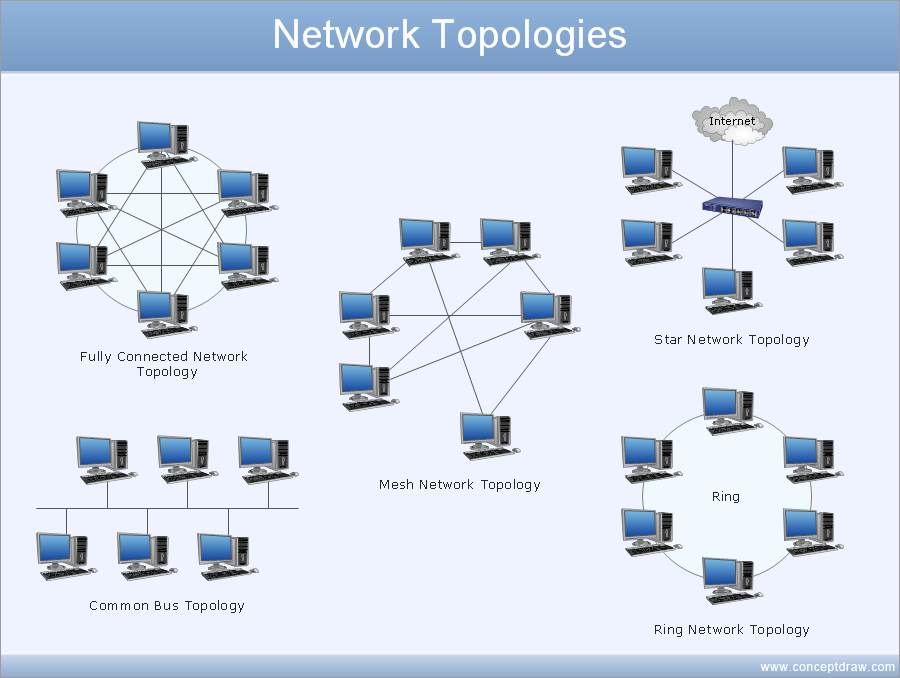
Network diagram is a chart which represents nodes and connections between them in computer network or any telecommunication network, it is a visual depiction of network architecture, physical or logical network topology. There are used common icons for the Network diagrams design, such as icons of various network appliances, computer devices, routers, clouds, peripheral devices, digital devices, etc. Network diagrams can represent networks of different scales (LAN level, WAN level) and detailization. ConceptDraw DIAGRAM diagramming software enhanced with Computer Network Diagrams solution from Computer and Networks area includes huge collection of computer and network templates, design objects and stencils, and numerous quantity of Network diagram examples and samples, among them: Basic Computer Network Diagrams, Communication Network Diagram, Wireless Router Network Diagram, LAN Topology Diagram, Computer Network System Design Diagram, Mobile Satellite Communication Network, Web-based Network Diagram, Hybrid Network Diagram, and many others.
Interactive Voice Response Network Diagram
ConceptDraw solution Computer and Networks provides Interactive Voice Response samples, templates and library of 35 vector stencils for drawing the IVR network diagrams. Use ConceptDraw DIAGRAM diagramming and vector drawing software enhanced with solution Computer and Networks to visualize the logical and physical structure of IVR systems for inbound and outbound call centers and voice mail systems.
 Enterprise Architecture Diagrams
Enterprise Architecture Diagrams solution extends ConceptDraw DIAGRAM software with templates, samples and library of vector stencils for drawing the diagrams of enterprise architecture models.
Draw Network Diagram based on Templates and Examples
ConceptDraw is rapid and powerful network diagram drawing software with rich examples, templates, design objects and stencils.
 Venn Diagrams
Venn Diagrams are actively used to illustrate simple set relationships in set theory and probability theory, logic and statistics, mathematics and computer science, linguistics, sociology, and marketing. Venn Diagrams are also often used to visually summarize the status and future viability of a project.
 Fault Tree Analysis Diagrams
This solution extends ConceptDraw DIAGRAM.5 or later with templates, fault tree analysis example, samples and a library of vector design elements for drawing FTA diagrams (or negative analytical trees), cause and effect diagrams and fault tree diagrams.
- Example Of Interactive System
- Interactive Voice Response Diagrams | How to Create an Interactive ...
- Network Diagram Software IVR Services | What is IVR? | Interactive ...
- Interactive Voice Response Network Diagram | Network Diagram ...
- Network Diagram Examples | Interactive Voice Response Network ...
- Interactive Voice Response Network Diagram | Interactive Voice ...
- UML Tool & UML Diagram Examples | Interactive Voice Response ...
- UML Diagram | UML Class Diagram Example for Transport System ...
- UML Tool & UML Diagram Examples | Interactive Voice Response ...
- | Telecommunication Network Diagrams | Interactive Voice ...
- Process Flowchart | Sales Process Flowchart. Flowchart Examples ...
- Interactive Voice Response Network Diagram | Network Diagram ...
- Examples And Images Of How Diagram Works In Contact Centre ...
- Interactive voice response (IVR) networks. Computer and Network ...
- Computer network diagram | ATM Network. Computer and Network ...
- IVR flowchart - Store reporting | Interactive Voice Response ...
- Interactive Voice Response Diagrams
- Interactive Voice Response Diagrams
- Telecommunication Network Diagrams | Interactive Voice Response ...
- | Interactive Voice Response Diagrams | Example Auto Attendant ...


