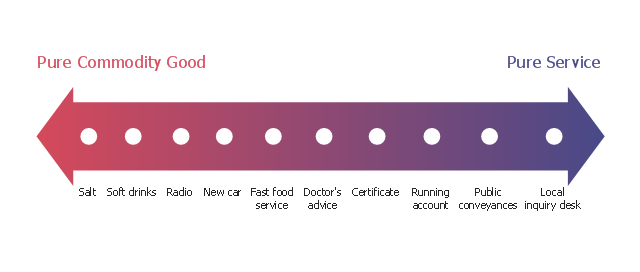
This marketing diagram sample depicts service-goods continuum.
"The dichotomy between physical goods and intangible services is an oversimplification; these are not discrete categories. Most business theorists see a continuum with pure service at one endpoint and pure commodity goods at the other endpoint. Most products fall between these two extremes. Goods are normally structural and can be transferred in an instant while services are delivered over a period of time. Goods can be returned while a service once delivered cannot. Goods are not always tangible and may be virtual." [Goods and services. Wikipedia]
The marketing chart example "Service-goods continuum diagram" was created using the ConceptDraw PRO diagramming and vector drawing software extended with the Marketing Diagrams solution from the Marketing area of ConceptDraw Solution Park.
Marketing chart
 Marketing Diagrams
Marketing Diagrams solution extends ConceptDraw DIAGRAM diagramming software with abundance of samples, templates and vector design elements intended for easy graphical visualization and drawing different types of Marketing diagrams and graphs, including Branding Strategies Diagram, Five Forces Model Diagram, Decision Tree Diagram, Puzzle Diagram, Step Diagram, Process Chart, Strategy Map, Funnel Diagram, Value Chain Diagram, Ladder of Customer Loyalty Diagram, Leaky Bucket Diagram, Promotional Mix Diagram, Service-Goods Continuum Diagram, Six Markets Model Diagram, Sources of Customer Satisfaction Diagram, etc. Analyze effectively the marketing activity of your company and apply the optimal marketing methods with ConceptDraw DIAGRAM software.
The vector stencils library "Marketing diagrams" contains 12 templates of marketing and sales diagrams and charts. Use it to illustrate your marketing and sales documents, presentations, infographics and webpages in ConceptDraw PRO software extended with Marketing Diagrams solution from Marketing area of ConceptDraw Solution Park.
Diffusion of Innovations

Normal distribution

Five forces model

Leaky bucket diagram

Funnel diagram

Relationship ladder of customer loyalty

Six markets model

Product life cycle graph

Extended product life cycle graph

Service-goods continuum diagram

Step chart block

Step diagram block

The vector stencils library "Marketing diagrams" contains 12 templates of marketing and sales diagrams and charts. Use it to illustrate your marketing and sales documents, presentations, infographics and webpages in ConceptDraw PRO software extended with Marketing Diagrams solution from Marketing area of ConceptDraw Solution Park.
Diffusion of Innovations
Normal distribution
Five forces model
Leaky bucket diagram
Funnel diagram
Relationship ladder of customer loyalty
Six markets model
Product life cycle graph
Extended product life cycle graph
Service-goods continuum diagram
Step chart block
Step diagram block
"Dimensions of service quality.
A customer's expectation of a particular service is determined by factors such as recommendations, personal needs and past experiences. The expected service and the perceived service sometimes may not be equal, thus leaving a gap. The service quality model or the ‘GAP model’ developed by a group of authors- Parasuraman, Zeithaml and Berry at Texas and North Carolina in 1985 , highlights the main requirements for delivering high service quality. It identifies five ‘gaps’ that cause unsuccessful delivery. Customers generally have a tendency to compare the service they 'experience' with the service they 'expect' . If the experience does not match the expectation , there arises a gap. Ten determinants that may influence the appearance of a gap were described by Parasuraman, Zeithaml and Berry. in the SERVQUAL model: reliability, responsiveness, competence, access, courtesy, communication, credibility, security, understanding the customer and tangibles.
Later, the determinants were reduced to five: tangibles; reliability; responsiveness; service assurance and empathy in the so called RATER model." [Service quality. Wikipedia]
The block diagram example "Gap model of service quality" was created using the ConceptDraw PRO diagramming and vector drawing software extended with the Block Diagrams solution from the area "What is a Diagram" of ConceptDraw Solution Park.
Block diagram

The Data flow diagram (DFD) example "Payment for goods using UPS code scanner" shows data flow in process of payment for goods in the shop using the MaxiCode scanner.
"MaxiCode is a public domain, machine-readable symbol system originally created and used by United Parcel Service. Suitable for tracking and managing the shipment of packages, it resembles a barcode, but uses dots arranged in a hexagonal grid instead of bars. MaxiCode has been standardised under ISO/ IEC 16023.
A MaxiCode symbol (internally called "Bird's Eye", "Target", "dense code", or "UPS code") appears as a 1 inch square, with a bullseye in the middle, surrounded by a pattern of hexagonal dots. It can store about 93 characters of information, and up to 8 MaxiCode symbols can be chained together to convey more data. The centered symmetrical bullseye is useful in automatic symbol location regardless of orientation, and it allows MaxiCode symbols to be scanned even on a package traveling rapidly." [MaxiCode. Wikipedia]
This example of data flow diagram (Gane & Sarson notation) was created using the ConceptDraw PRO diagramming and vector drawing software extended with the Data Flow Diagrams solution from the Software Development area of ConceptDraw Solution Park.
DFD
---payment-for-goods-using-ups-code-scanner.png--diagram-flowchart-example.png)
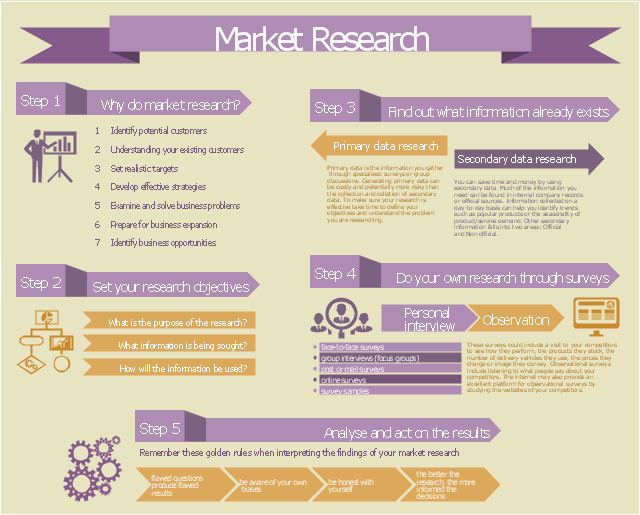
This example of marketing infogram was created on the base of web page "Market research" from the website of West Australian State Government agency Small Business Development Corporation (SBDC).
"Market research is a key part of developing your marketing strategy. It’s about collecting information to give you an insight into your customers’ mind so that you understand what they want, how they gather information and where they come from. You can also do market research to get a better idea of market trends and what is happening in your industry sector.
The information you gather and analyse builds the foundation of good business decisions whether it’s deciding what product or service you’ll offer, where your business should be located, how to distribute your products or how you communicate with consumers." [smallbusiness.wa.gov.au/ market-research]
The example "Marketing Infographics - Market Research" was created using the ConceptDraw PRO diagramming and vector drawing software extended with the Marketing Infographics solition from the area "Business Infographics" in ConceptDraw Solution Park.
Marketing infogram
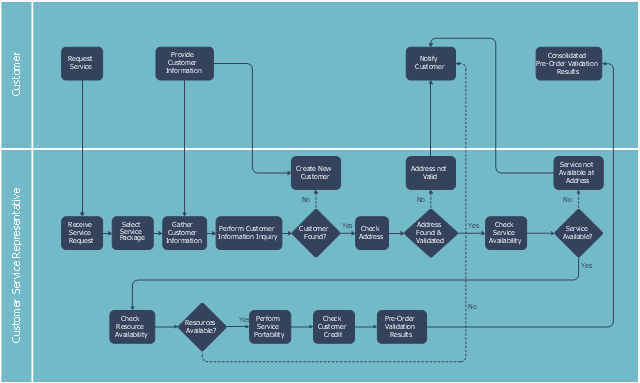
This swim lane diagram sample shows the telecom services process flow.
"Telecommunication is communication at a distance by technological means, particularly through electrical signals or electromagnetic waves. ...
Electrical and electromagnetic telecommunication technologies include telegraph, telephone, and teleprinter, networks, radio, microwave transmission, fiber optics, communications satellites and the Internet." [Telecommunication. Wikipedia]
"A telecommunications service provider or TSP is a type of communications service provider that has traditionally provided telephone and similar services. This category includes incumbent local exchange carriers, competitive local exchange carriers, and mobile wireless communication companies. ...
While some people use the terms "telecom service provider" and "communications service provider" interchangeably, the term TSP generally excludes Internet service providers (ISPs), cable companies, satellite TV, and managed service providers. ...
TSPs provide access to telephone and related communications services." [Telecommunications service provider. Wikipedia]
The cross-functional flowchart example "Providing telecom services" was created using the ConceptDraw PRO diagramming and vector drawing software extended with the Cross-Functional Flowcharts solution from the Business Processes area of ConceptDraw Solution Park.
Swin lane diagram
"As a discipline, task management embraces several key activities. Various conceptual breakdowns exist, and these, at a high-level, always include creative, functional, project, performance and service activities.
Creative activities pertain to task creation. In context, these should allow for task planning, brainstorming, creation, elaboration, clarification, organization, reduction, targeting and preliminary prioritization.
Functional activities pertain to personnel, sales, quality or other management areas, for the ultimate purpose of ensuring production of final goods and services for delivery to customers. In context these should allow for planning, reporting, tracking, prioritizing, configuring, delegating, and managing of tasks.
Project activities pertain to planning and time and costs reporting. These can encompass multiple functional activities but are always greater and more purposeful than the sum of its parts. In context project activities should allow for project task breakdown, task allocation, inventory across projects, and concurrent access to task databases.
Service activities pertain to client and internal company services provision, including customer relationship management and knowledge management. In context these should allow for file attachment and links to tasks, document management, access rights management, inventory of client & employee records, orders & calls management, and annotating tasks.
Performance activities pertain to tracking performance and fulfillment of assigned tasks. In context these should allow for tracking by time, cost control, stakeholders and priority; charts, exportable reports, status updates, deadline adjustments, and activity logging.
Report activities pertain to the presentation of information regarding the other five activities listed, including graphical display." [Task management. Wikipedia]
The example "Project tasks dashboard" was created using the ConceptDraw PRO diagramming and vector drawing software extended with the Status Dashboard solution from the area "What is a Dashboard" of ConceptDraw Solution Park.
Project tasks dashboard

This marketing diagram sample illustrates leaky bucket model.
"The leaky bucket theory. The leaky bucket theory is the model that seeks to describe the process of customer gain and loss, otherwise known as customer churn. Customer retention is one of the key concepts in relationship marketing. Most companies concentrate on recruiting new customers to replace customers who move on, rather than seeking to retain customers." [Blythe J. Key Concepts in Marketing. 2009. knowledge.sagepub.com/ view/ key-concepts-in-marketing/ n5.xml]
"Customer attrition, also known as customer churn, customer turnover, or customer defection, is the loss of clients or customers.
Banks, telephone service companies, Internet service providers, pay TV companies, insurance firms, and alarm monitoring services, often use customer attrition analysis and customer attrition rates as one of their key business metrics (along with cash flow, EBITDA, etc.) because the "...cost of retaining an existing customer is far less than acquiring a new one." Companies from these sectors often have customer service branches which attempt to win back defecting clients, because recovered long-term customers can be worth much more to a company than newly recruited clients." [Customer attrition. Wikipedia]
The chart example "Leaky bucket diagram" was created using the ConceptDraw PRO diagramming and vector drawing software extended with the Marketing Diagrams solution from the Marketing area of ConceptDraw Solution Park.
Marketing chart

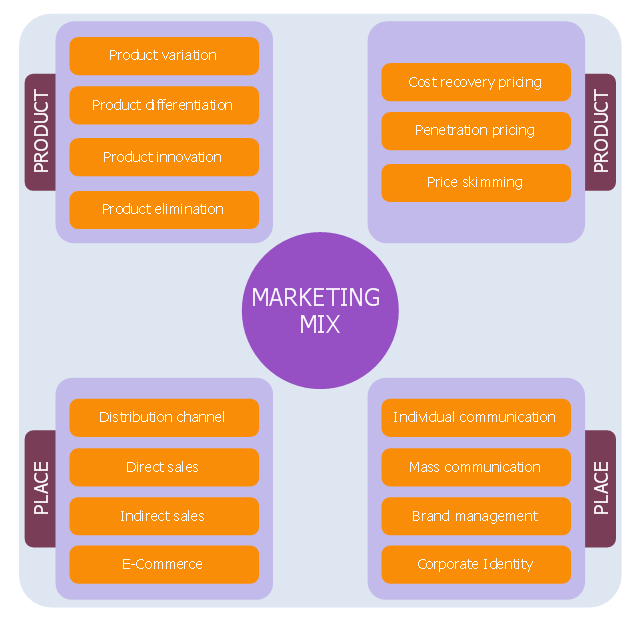
This diagram sample depicts marketing mix. It was designed on the base of the Wikimedia Commons file: Marketing-Mix (en).png.
[commons.wikimedia.org/ wiki/ File:Marketing-Mix_ %28en%29.png]
"The marketing mix is a business tool used in marketing and by marketeers . The marketing mix is often crucial when determining a product or brand's offer, and is often associated with the four P's: price, product, promotion, and place. In service marketing, however, the four Ps are expanded to the seven P's or eight P's to address the different nature of services.
In the 1990s, the concept of four C's was introduced as a more customer-driven replacement of four P's. There are two theories based on four Cs: Lauterborn's four Cs (consumer, cost, communication, convenience), and Shimizu's four Cs (commodity, cost, communication, channel).
In 2012, a new four P's theory was proposed with people, processes, programs, and performance." [Marketing mix. Wikipedia]
The chart example "Marketing mix diagram" was created using the ConceptDraw PRO diagramming and vector drawing software extended with the Marketing Diagrams solution from the Marketing area of ConceptDraw Solution Park.
Chart example
This circle-spoke diagram sample shows how leadership and data provide essential coordination of other functions in an asset management environment. Leadership points the way and common data systems keep all divisions communicating effectively.
This circle-spoke diagram example was created on the base of illustration of article "Beyond the Short Term: Transportation Asset Management for Long-Term Sustainability, Accountability and Performance" from the website of The Federal Highway Administration (FHWA).
[fhwa.dot.gov/ asset/ 10009/ tam_ topr806_ 3.cfm]
"Asset management, broadly defined, refers to any system that monitors and maintains things of value to an entity or group. It may apply to both tangible assets such as buildings and to intangible concepts such as intellectual property and goodwill. Asset management is a systematic process of operating, maintaining, upgrading, and disposing of assets cost-effectively. Alternative views of asset management in the engineering environment are: the practice of managing assets to achieve the greatest return (particularly useful for productive assets such as plant and equipment), and the process of monitoring and maintaining facilities systems, with the objective of providing the best possible service to users (appropriate for public infrastructure assets)." [Asset management. Wikipedia]
The hub-and-spoke diagram example "Leadership and data" was created using the ConceptDraw PRO diagramming and vector drawing software extended with the Circle-Spoke Diagrams solution from the area "What is a Diagram" of ConceptDraw Solution Park.
Circle-spoke diagram

"A value chain is a chain of activities that a firm operating in a specific industry performs in order to deliver a valuable product or service for the market. ...
The concept of value chains as decision support tools, was added onto the competitive strategies paradigm developed by Porter as early as 1979. In Porter's value chains, Inbound Logistics, Operations, Outbound Logistics, Marketing and Sales and Service are categorized as primary activities. Secondary activities include Procurement, Human Resource management, Technological Development and Infrastructure." [Value chain. Wikipedia]
This Porter's value chain matrix diagram example was created using the ConceptDraw PRO diagramming and vector drawing software extended with the Matrices solution from the Marketing area of ConceptDraw Solution Park.
Porter's value chain matrix

Pyramid Diagram

This circular diagram sample was created on the base of the figure from the Florence-Darlington Technical College website. [bus.fdtc.edu/ sbed/ core/ core7.html]
"A marketing plan may be part of an overall business plan. Solid marketing strategy is the foundation of a well-written marketing plan. While a marketing plan contains a list of actions, a marketing plan without a sound strategic foundation is of little use. ...
A marketing plan for a small business typically includes Small Business Administration Description of competitors, including the level of demand for the product or service and the strengths and weaknesses of competitors:
(1) Description of the product or service, including special features.
(2) Marketing budget, including the advertising and promotional plan.
(3) Description of the business location, including advantages and disadvantages for marketing.
(4) Pricing strategy.
(5) Market Segmentation." [Marketing plan. Wikipedia]
The circular diagram example "Marketing plan" was created using the ConceptDraw PRO diagramming and vector drawing software extended with the Target and Circular Diagrams solution from the Marketing area of ConceptDraw Solution Park.
www.conceptdraw.com/ solution-park/ marketing-target-and-circular-diagrams
Circular diagram

"Causes in the diagram are often categorized, such as to ...
The 7 Ps (used in marketing industry):
(1) Product/ Service;
(2) Price;
(3) Place;
(4) Promotion;
(5) People/ personnel;
(6) Positioning;
(7) Packaging. " [Ishikawa diagram. Wikipedia]
This 8 Ps Ishikawa diagram (service cause and effect diagram) template is included in the Fishbone Diagram solution from the Management area of ConceptDraw Solution Park.
8Ps fishbone diagram

"Ecosystems represent sources of natural capital and provide goods and services to society, also called ecosystem services. The Millennium Ecosystem Assessment identified over 24 ecosystem services that can be divided up into 4 general groups including: 1) provisioning, 2) supporting, 3) regulating and 4) cultural." [User:Sawtoothgirl/ Sustainable Real Estate Development. Wikipedia]
"Humankind benefits in a multitude of ways from ecosystems. Collectively, these benefits are known as ecosystem services. Ecosystem services are regularly involved in the provisioning of clean drinking water and the decomposition of wastes. While scientists and environmentalists have discussed ecosystem services implicitly for decades, these the ecosystem services concept itself was popularized by the Millennium Ecosystem Assessment (MA) in the early 2000s. This grouped ecosystem services into four broad categories: provisioning, such as the production of food and water; regulating, such as the control of climate and disease; supporting, such as nutrient cycles and crop pollination; and cultural, such as spiritual and recreational benefits. To help inform decision-makers, many ecosystem services are being assigned economic values." [Ecosystem services. Wikipedia]
The segmented pyramid diagram example "Ecosystem goods and services" was redesigned using the ConceptDraw PRO diagramming and vector drawing software from Wikimedia Commons file ES_ triangle.png.
[commons.wikimedia.org/ wiki/ File:ES_ triangle.png]
This file is licensed under the Creative Commons Attribution-Share Alike 3.0 Unported license. [creativecommons.org/ licenses/ by-sa/ 3.0/ deed.en]
This segmented pyramid diagram example "Ecosystem goods and services" is included in the Pyramid Diagrams solution from the Marketing area of ConceptDraw Solution Park.
Pyramid diagram

This line chart sample depicts data from the European Economic Forecast (EUROPEAN ECONOMY 1|2013, Economic and Financial Affairs Winter 2013, European Commission).
[ec.europa.eu/ economy_ finance/ publications/ european_ economy/ 2013/ pdf/ ee1_ en.pdf]
"Exports in France decreased to 36526 EUR Million in October of 2013 from 36637 EUR Million in September of 2013. Exports in France is reported by the Ministère de l'Économie et des Finances. Exports in France averaged 17102.29 EUR Million from 1970 until 2013, reaching an all time high of 37964 EUR Million in August of 2012 and a record low of 1165.60 EUR Million in May of 1970. France is one of the largest exporters of luxury goods and agricultural products in the world. France main exports are: aircrafts (10.1 percent of total exports), food (9.7 percent), chemicals (9.5 percent), industrial machinery (8.3 percent), iron and steel (7.9 percent), electronics (6.7 percent), motor vehicles (6.3 percent) and pharmaceuticals (6.1 percent). Trade outflows to Europe account for 70 percent of total exports. Main export partners are: Germany (16.6 percent of total exports), Italy (8.2 percent), Spain (7.3 percent), Belgium (7.2 percent), the United Kingdom (6.6 percent), the United States (5.6 percent), Netherlands and China. This page contains - France Exports - actual values, historical data, forecast, chart, statistics, economic calendar and news." [tradingeconomics.com/ france/ exports]
The line graph example "France exports of goods and services" was created using ConceptDraw PRO diagramming and vector drawing software extended with Line Graphs solution from Graphs and Charts area of ConceptDraw Solution Park.
Line chart

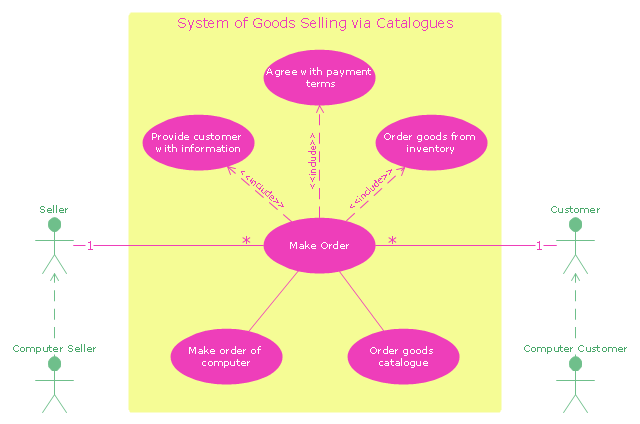
"A catalog merchant (catalogue merchant in British and Canadian English) is a form of retailing. The typical merchant sells a wide variety of household and personal products, with many emphasizing jewelry. Unlike a self-serve retail store, most of the items are not displayed; customers select the products from printed catalogs in the store and fill out an order form. The order is brought to the sales counter, where a clerk retrieves the items from the warehouse area to a payment and checkout station. ...
The catalog merchant has generally lower prices than other retailers and lower overhead expenses due to the smaller size of store and lack of large showroom space.
There are a few key benefits to this approach. By operating as an in-store catalog sales center, it could be exempt from the "Resale price maintenance" policy of the manufacturers, which can force conventional retailers to charge a minimum sales price to prevent price-cutting competition; it also reduces the risk of merchandise theft, known in the industry as shrinkage.
From the consumer's point of view, there are potential advantages and disadvantages. The catalog showroom approach allows customers to shop without having to carry their purchases throughout the store as they shop. Possible downsides include that customers may be required to give their contact information when an order is placed, take the time to fill out order forms, and wait a period of time for their order to be available for purchase. This wait may be days long, one of the chief vulnerabilities of the catalog showroom approach." [Catalog merchant. Wikipedia]
The UML use case diagram example "System of goods selling via catalogues" was created using the ConceptDraw PRO diagramming and vector drawing software extended with the Rapid UML solution from the Software Development area of ConceptDraw Solution Park.
UML use case diagram
"A warehouse is a commercial building for storage of goods. Warehouses are used by manufacturers, importers, exporters, wholesalers, transport businesses, customs, etc. They are usually large plain buildings in industrial areas of cities and towns and villages. They usually have loading docks to load and unload goods from trucks. Sometimes warehouses are designed for the loading and unloading of goods directly from railways, airports, or seaports. They often have cranes and forklifts for moving goods, which are usually placed on ISO standard pallets loaded into pallet racks. Stored goods can include any raw materials, packing materials, spare parts, components, or finished goods associated with agriculture, manufacturing and production." [Warehouse. Wikipedia]
The example "Warehouse layout floor plan" was created using the ConceptDraw PRO diagramming and vector drawing software extended with the Plant Layout Plans solution from the Building Plans area of ConceptDraw Solution Park.
The example "Warehouse layout floor plan" was created using the ConceptDraw PRO diagramming and vector drawing software extended with the Plant Layout Plans solution from the Building Plans area of ConceptDraw Solution Park.
Warehouse equipment layout

- Service- goods continuum diagram | Explain Good Service Continuum
- Service- goods continuum diagram | Good Service Continuum ...
- Service - goods continuum diagram | Marketing Diagrams | Pyramid ...
- Service - goods continuum diagram | Meaning Of Goods Services ...
- Service - goods continuum diagram | Marketing diagrams - Vector ...
- Service - goods continuum diagram | Providing telecom services ...
- Service - goods continuum diagram | France exports of goods and ...
- Service - goods continuum diagram | Marketing Diagrams | Marketing ...
- Service - goods continuum diagram | Explain Concept Of Good ...
- Service - goods continuum diagram | Meaning Of Goods Continumm
- Service - goods continuum diagram | Marketing Diagrams | Process ...
- | What Is Product Service Continum
- Block diagram - Gap model of service quality | Service - goods ...
- Flowchart Marketing Process. Flowchart Examples | Service - goods ...
- Service - goods continuum diagram | Process Flowchart | Marketing ...
- Service - goods continuum diagram | Pyramid Chart Examples ...
- Service - goods continuum diagram | AWS Architecture Diagrams ...
- Service - goods continuum diagram | Marketing Diagrams | Marketing ...
- Block diagram - Gap model of service quality | Service 4 Ss fishbone ...
- Pyramid Chart Examples | Service - goods continuum diagram ...