This example of bank ATM UML activity diagram was created on the base of UML use case diagram of automated teller machine from the course "Thinking in Java, 2nd edition, Revision 9" by Bruce Eckel published on the website of the Computer Science and Electrical Engineering Department of the University of Maryland, Baltimore (UMBC).
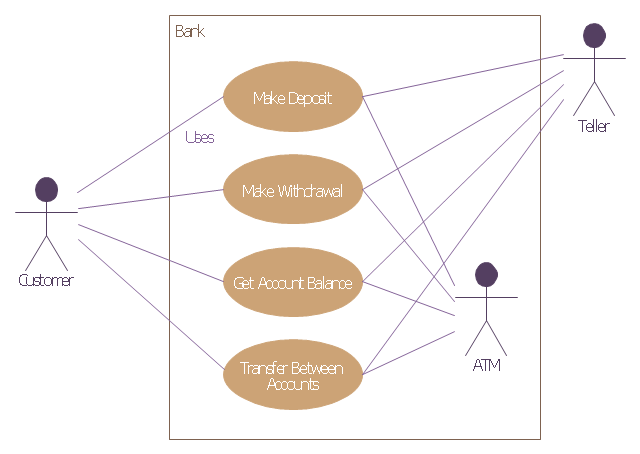
"If you are designing an auto-teller, for example, the use case for a particular aspect of the functionality of the system is able to describe what the auto-teller does in every possible situation. Each of these “situations” is referred to as a scenario, and a use case can be considered a collection of scenarios. You can think of a scenario as a question that starts with: “What does the system do if...?” For example, “What does the auto-teller do if a customer has just deposited a check within the last 24 hours, and there’s not enough in the account without the check having cleared to provide a desired withdrawal?”
Use case diagrams are intentionally simple to prevent you from getting bogged down in system implementation details prematurely...
Each stick person represents an “actor,” which is typically a human or some other kind of free agent. (These can even be other computer systems, as is the case with “ATM.”) The box represents the boundary of your system. The ellipses represent the use cases, which are descriptions of valuable work that can be performed with the system. The lines between the actors and the use cases represent the interactions.
It doesn’t matter how the system is actually implemented, as long as it looks like this to the user."
[csee.umbc.edu/ courses/ 331/ resources/ tij/ text/ TIJ213.gif]
This automated teller machine (ATM) UML use case diagram example was created using the ConceptDraw PRO diagramming and vector drawing software extended with the ATM UML Diagrams solution from the Software Development area of ConceptDraw Solution Park.
Bank ATM UML sequence diagram
Bubble diagrams in Landscape Design with ConceptDraw DIAGRAM

 Classic Business Process Modeling
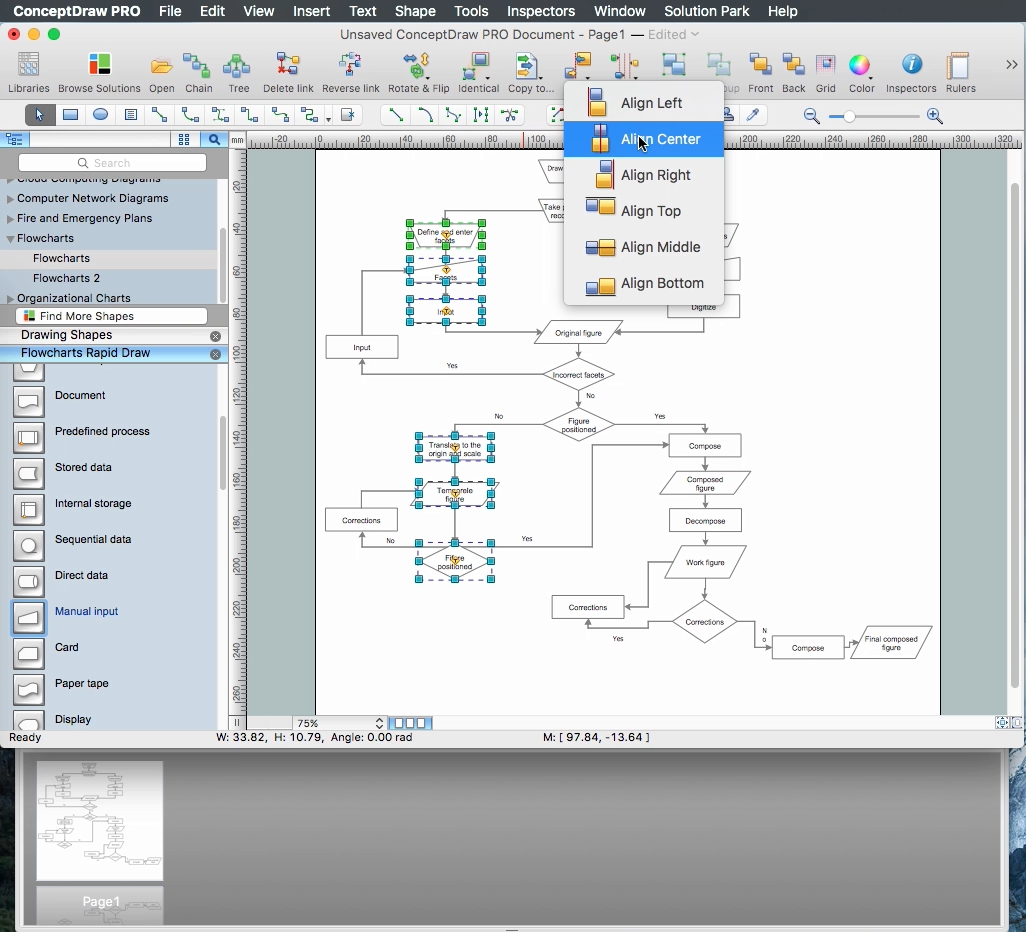
The ConceptDraw DIAGRAM software enhanced with Classic Business Process Modeling solution is a powerful flowchart maker and professional business process modeling software with extensive choice of drawing tools, libraries with wide variety of ready-to-use vector objects that are more than sufficient for modeling the business processes and for instant creation variety of diagram types: Control Flow Diagram, Swimlane Diagram, Business Process Modeling Diagram, Functional Flow Block Diagram, Data Flow Diagram. It is ideal for business analysts, developers, as well as for managers and regular users. The samples included to Classic Business Process Modeling solution allow to uncover the solution’s power and to answer qualitatively on how to create a flowchart or to model the business processes with help of diagrams and schemes.
Sales Steps

Chemistry Drawings

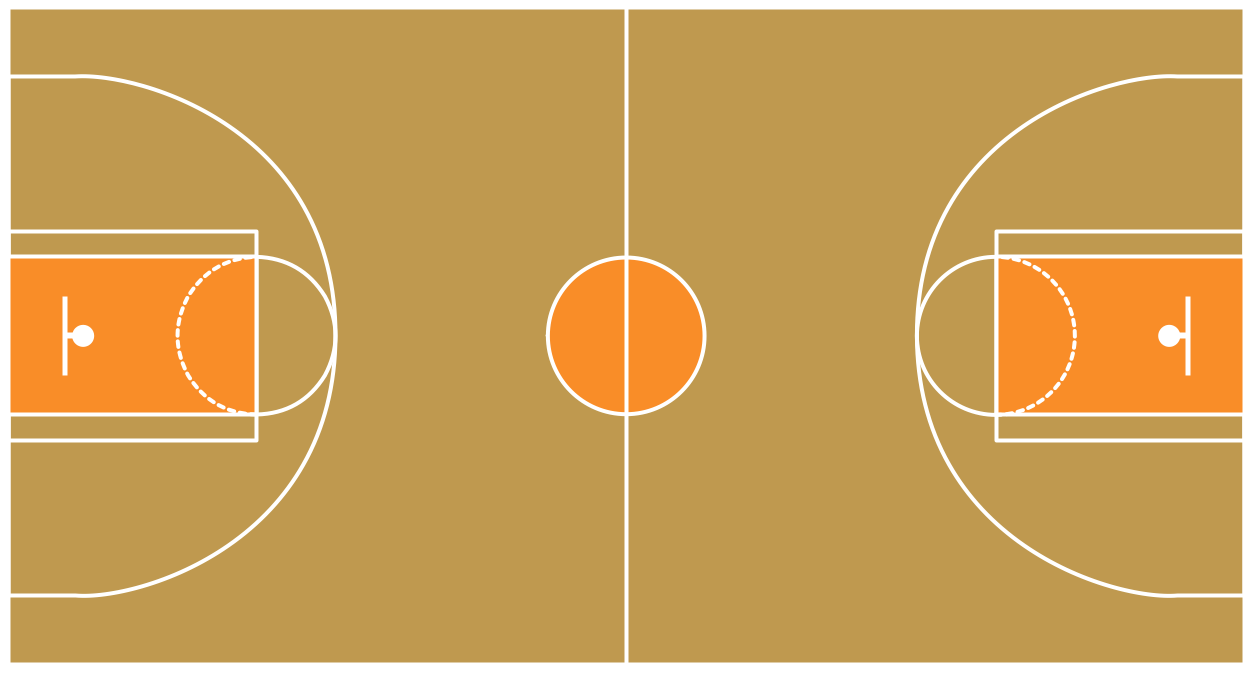
Basketball Field in the Vector
How to Build a Flowchart
- UML Activity Diagram | UML Diagram of Parking | Process Flowchart ...
- Use Case Diagram For Car Parking System
- UML activity diagram - Cash withdrawal from ATM | ATM UML ...
- Bank Activity Diagram
- UML use case diagram - Project administrator
- UML activity diagram - Cash withdrawal from ATM | UML Activity ...
- UML Diagrams with ConceptDraw PRO | Diagramming Software for ...
- Use Case Diagram Uml Multiple Actor Representation
- Credit Card Order Process Flowchart. Flowchart Examples | Credit ...
- Bank Detailed Answers | UML activity diagram - Cash withdrawal ...
- Bank ATM use case diagram | UML Use Case Diagram Example ...
- UML Use Case Diagram Example Social Networking Sites Project ...
- Use Case Diagrams technology with ConceptDraw PRO | UML Use ...
- UML for Bank | UML Use Case Diagram Example . Services UML ...
- Bank ATM use case diagram | UML Diagram | How to Create a Bank ...
- UML activity diagram - Cash withdrawal from ATM | UML Activity ...
- Design elements - UML use case diagrams
- UML use case diagram - Banking system | How to Create a Bank ...
- Bank System | Banking System | Class UML Diagram for Bank ...
- UML use case diagram - Banking system