 Event-driven Process Chain Diagrams
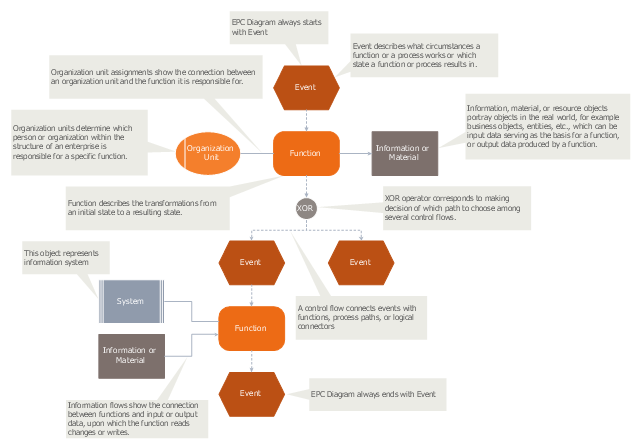
Event-driven Process Chain (EPC) Diagram is a type of flowchart widely used for modeling in business engineering and reengineering, business process improvement, and analysis. EPC method was developed within the Architecture of Integrated Information Systems (ARIS) framework.
HelpDesk
Event-driven Process Chain (EPC) Diagram Software

"An Event-driven Process Chain (EPC) is a type of flowchart used for business process modelling. Event-driven Process Chains can be used for configuring an enterprise resource planning (ERP) implementation, and for business process improvement. ...
Businesses use Event-driven Process Chain diagrams to lay out business process work flows, originally in conjunction with SAP R/ 3 modeling, but now more widely. It is used by many companies for modeling, analyzing, and redesigning business processes. The Event-driven Process Chain method was developed within the framework of Architecture of Integrated Information Systems (ARIS). As such it forms the core technique for modeling in ARIS, which serves to link the different views in the so-called control view." [Event-driven process chain. Wikipedia]
The event-driven process chain (EPC) diagram template for the ConceptDraw PRO diagramming and vector drawing software is included in the Event-driven Process Chain Diagrams solution from the Business Processes area of ConceptDraw Solution Park.
EPC diagram template
Business Process Modeling Notation Template
 B2B process diagram BPMN 2.0 - Cab booking process")
HelpDesk
How to Create a BPMN Diagram Using ConceptDraw PRO

HelpDesk
How to Create a Fault Tree Analysis Diagram (FTD) in ConceptDraw PRO

- Copying Service Process Flowchart . Flowchart Examples | Event ...
- Process Flowchart | Process flow diagram (PFD) template | Business ...
- Cross-Functional Flowcharts | Business process Flow Chart - Event ...
- Process Flowchart | An Event -driven Process Chain (EPC ...
- Flowchart | Business process Flow Chart - Event -Driven Process ...
- Event -driven Process Chain Diagrams EPC
- Event Booking Flowchart
- Business Process Diagram | Process Flowchart | Cross-Functional ...
- Process Flowchart | Business process Flow Chart - Event -Driven ...
- Web Diagram Template Microsoft Word
- Event -driven Process Chain Diagrams EPC | Business Process ...
- Sales Process Flowchart . Flowchart Examples | Event -driven ...
- IDEF0 diagram template | Process Flowchart | IDEF0 Diagram ...
- How To Create a MS Visio Business Process Diagram Using ...
- IDEF0 Visio | Basic Audit Flowchart . Flowchart Examples | Event ...
- Process Flowchart | Business Process Modeling with ConceptDraw ...
- EPC diagram - Template | Event -driven Process Chain Diagrams ...
- Data Flow Diagram Ppt For Event Management System
- Process Flowchart | Flow chart Example. Warehouse Flowchart ...
- Accounting Flowcharts | Accounting Flowcharts | Event -driven ...