 Entity-Relationship Diagram (ERD)
An Entity-Relationship Diagram (ERD) is a visual presentation of entities and relationships. That type of diagrams is often used in the semi-structured or unstructured data in databases and information systems. At first glance ERD is similar to a flowch
Design Element: Crows Foot for Entity Relationship Diagram - ERD

Flowchart Maker

Entity-Relationship Diagram

Entity Relationship Software

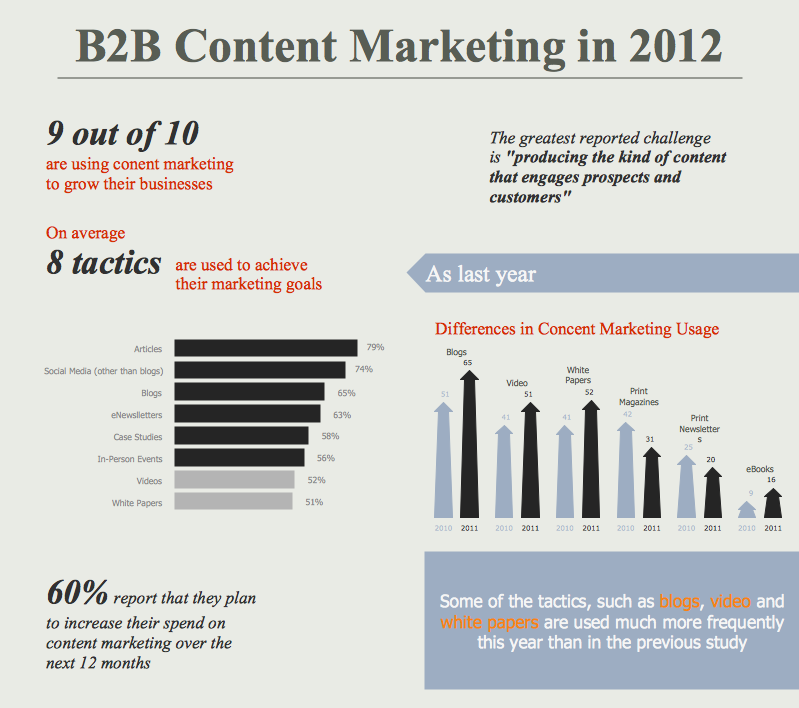
Content Marketing Infographics
Software development with ConceptDraw DIAGRAM

Business Process Mapping — How to Map a Work Process

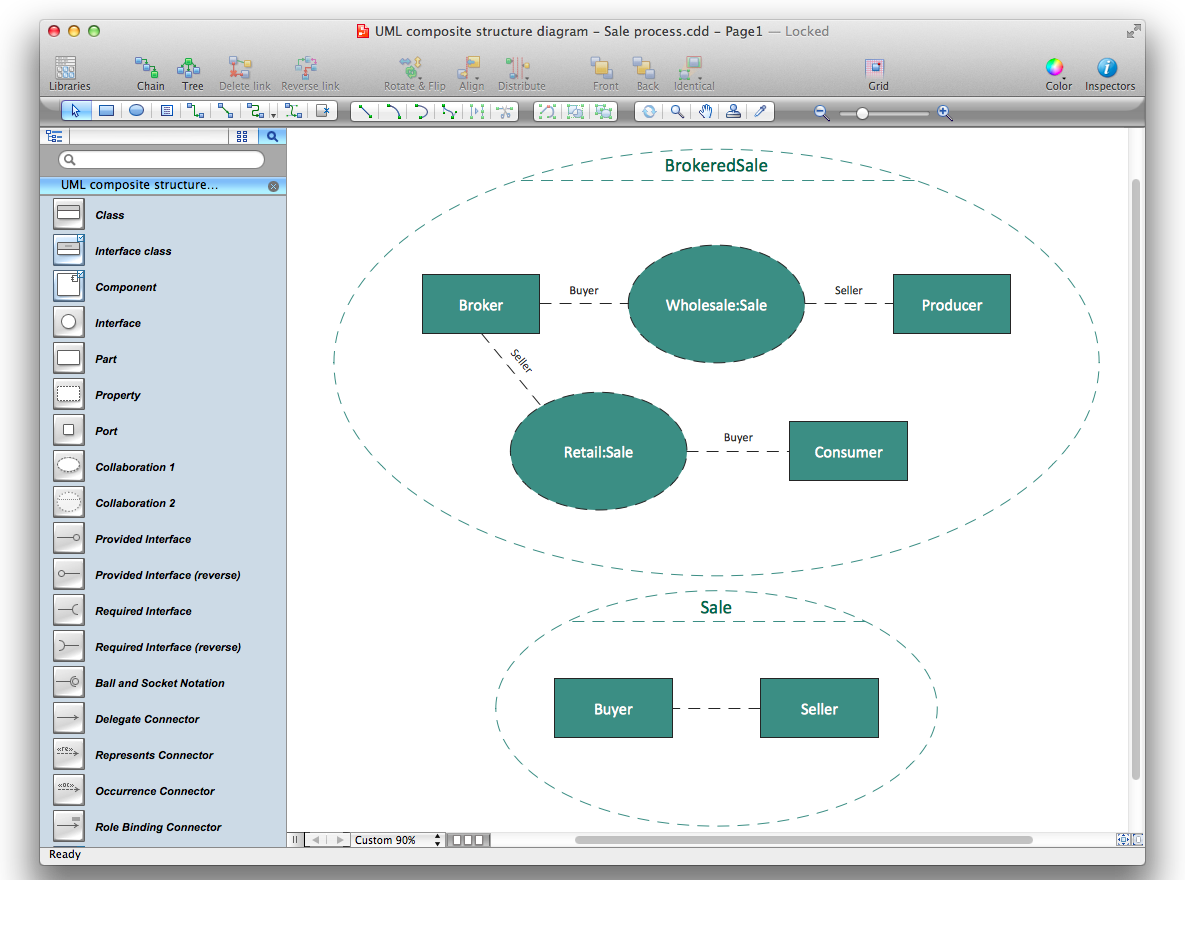
Diagramming Software for UML Composite Structure Diagrams

- Erd Model For Images Photography Studio
- How To Make An Erd For Images Photography Studio
- Entity-Relationship Diagram ( ERD ) | Class Diagram Hd Photo
- Banking Management System Er Diagram Hd Photos
- DroidDia prime | Entity-Relationship Diagram ( ERD ) | Website ...
- Er Diagram For Photo Editor App
- Uml Diagram For Image Editor
- Audio, Video, Media | Entity-Relationship Diagram ( ERD ) | Website ...
- Entity-Relationship Diagram ( ERD ) | Er Diagram College ...
- Image Enhancement Er Diagram