Entity-Relationship Diagram (ERD) with ConceptDraw DIAGRAM
 <br>with ConceptDraw DIAGRAM *")

Design Element: Chen for Entity Relationship Diagram - ERD

Entity Relationship Software

How to Draw Pictorial Chart. How to Use Infograms

Geo Map — Australia — New Zealand

CCTV Network Example

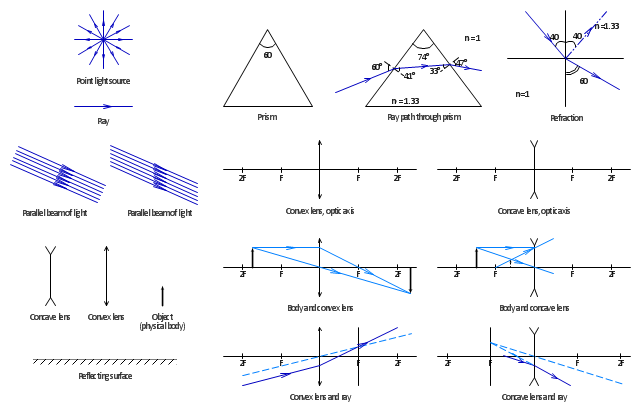
The vector stencils library "Optics" contains 17 symbol icons: reflecting surface; convex and concave lens with and without optic axis, body or ray; ray; parallel beam of light; point light source; prism with and without ray path; refraction.
Use these shapes for drawing schemes of physical experiments in geometrical optics and ray tracing diagrams.
"Geometrical optics, or ray optics, describes light propagation in terms of "rays". The "ray" in geometric optics is an abstraction, or "instrument", which can be used to approximately model how light will propagate. Light rays are defined to propagate in a rectilinear path as they travel in a homogeneous medium. Rays bend (and may split in two) at the interface between two dissimilar media, may curve in a medium where the refractive index changes, and may be absorbed and reflected. Geometrical optics provides rules, which may depend on the color (wavelength) of the ray, for propagating these rays through an optical system. This is a significant simplification of optics that fails to account for optical effects such as diffraction and interference. It is an excellent approximation, however, when the wavelength is very small compared with the size of structures with which the light interacts. Geometric optics can be used to describe the geometrical aspects of imaging, including optical aberrations." [Geometrical optics. Wikipedia]
The example "Design elements - Optics" was created using the ConceptDraw PRO diagramming and vector drawing software extended with the Physics solution from the Science and Education area of ConceptDraw Solution Park.
Optical symbols
- Entity-Relationship Diagram ( ERD ) | Er Diagram For Tour ...
- Er Diagram Of Tour And Travel Management System
- Er Diagram For Tour And Travel Management System
- Er Diagram Tour And Travel Agency
- Entity Relationship Diagram For Travel Agency
- Entity-Relationship Diagram ( ERD ) | How To Design Erd For Tour ...
- Uml Diagrams For Tours And Travels Management System
- Er Diagram For Cable Management System
- IDEF3 Standard | Business Process Workflow Diagrams | Venn ...
- Taxi Service Data Flow Diagram DFD Example | Accounting Data ...
- Data Flow Diagram Of Travel Management System
- Business Process Diagrams | How To Create a Workflow Diagram ...
- Taxi Service Data Flow Diagram DFD Example | How To Create a ...
- Automated payroll management system UML activity diagram | Tour ...
- Class Diagram For Travel And Tourism Management System
- The 100th Tour de France - Route map | How to Create a Powerful ...
- Stakeholder Management System | Workflow Diagram Examples ...
- Process Flowchart | Accounting Data Flow from the Accounting ...
- Er Diagram For Calendar Application
- Travel And Tourism Data Flow Diagram