Developing Entity Relationship Diagrams
When you need to visually represent the structure of relational database, Entity relationship diagram (ERD) is a type of diagram for that case. Most entity-relationship diagrams can be built with objects from Flowchart solution or ERD Solution which contains inbuilt templates. Follow these steps to create your own custom ERD diagram. Don't be frightened if it looks complex, ConceptDraw DIAGRAM makes it easy to create an ERD, and hundreds of other diagrams, in minutes.Entity Relationship Diagram Examples
Creation of Entity-Relationship (ER) model is a visual representation the structure of a business database, where data equates to entities or objects, which are linked by defined relationships expressing dependencies and requirements. By the nature, the ER model is an abstract visualization, a first step in design process towards creating a logical and functional database. ConceptDraw DIAGRAM professional software gives the ability to effectively describe a database using the Entity-Relationship model. Included to ConceptDraw Solution Park, the Entity-Relationship Diagram (ERD) solution contains the set of predesigned vector icons advocated by Chen's and Crow’s Foot notations that both can be used for data modeling and describing a database. Entity-Relationship Diagram (ERD) solution includes also helpful templates and incredibly large collection of varied Entity Relationship Diagram examples and samples offered at ConceptDraw STORE. Each of them can be used to develop your own model of a database of arbitrary complexity.
 Telecommunication Network Diagrams
Telecommunication Network Diagrams solution extends ConceptDraw DIAGRAM software with samples, templates, and great collection of vector stencils to help the specialists in a field of networks and telecommunications, as well as other users to create Computer systems networking and Telecommunication network diagrams for various fields, to organize the work of call centers, to design the GPRS networks and GPS navigational systems, mobile, satellite and hybrid communication networks, to construct the mobile TV networks and wireless broadband networks.
Network Diagram Software Home Area Network
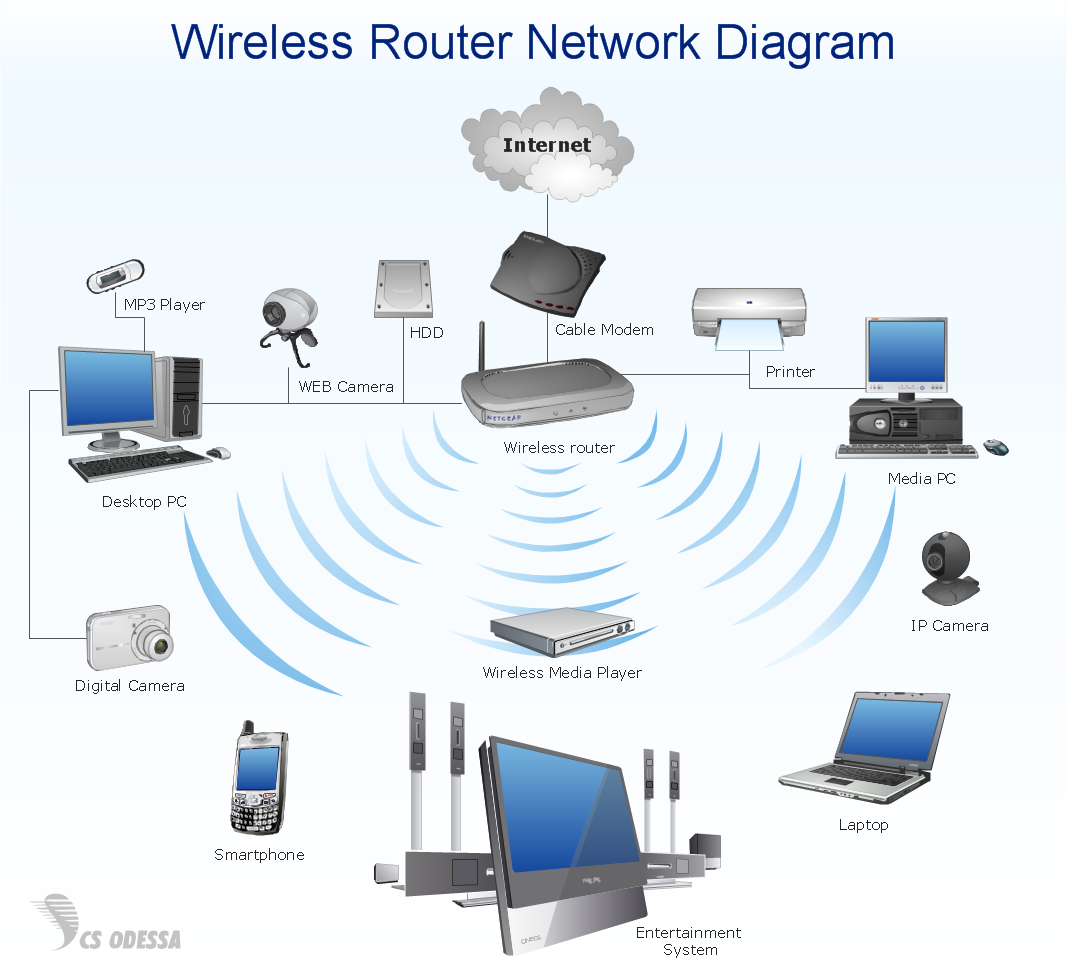
A Home Area Network (HAN) is a type of computer network which provides a communication between devices in neighborhood of a home. For construction a HAN are used modem, router, network switch, wireless access point, home automation controller, network bridge, and also various smart devices, network printers, handheld mobile computers, etc. All these devices are capable efficiently interact each other and so give wide possibilities for automation the execution of repetitious tasks, increasing a home security, improvement quality of life inside a home, enhancement a personal productivity, and also make easier an access to entertainment. Home Area Networks can be constructed using a wired or wireless technologies to connect endpoints. Wireless is predominant for homes due to the ease of its installation and absence of unsightly cables. ConceptDraw DIAGRAM software extended with Computer Network Diagrams solution lets easy visualize the communication schemes of Home Area Networks and illustrate the networks arrangement in houses on the Home Area Network Diagrams.
How To Create CCTV Network Diagram
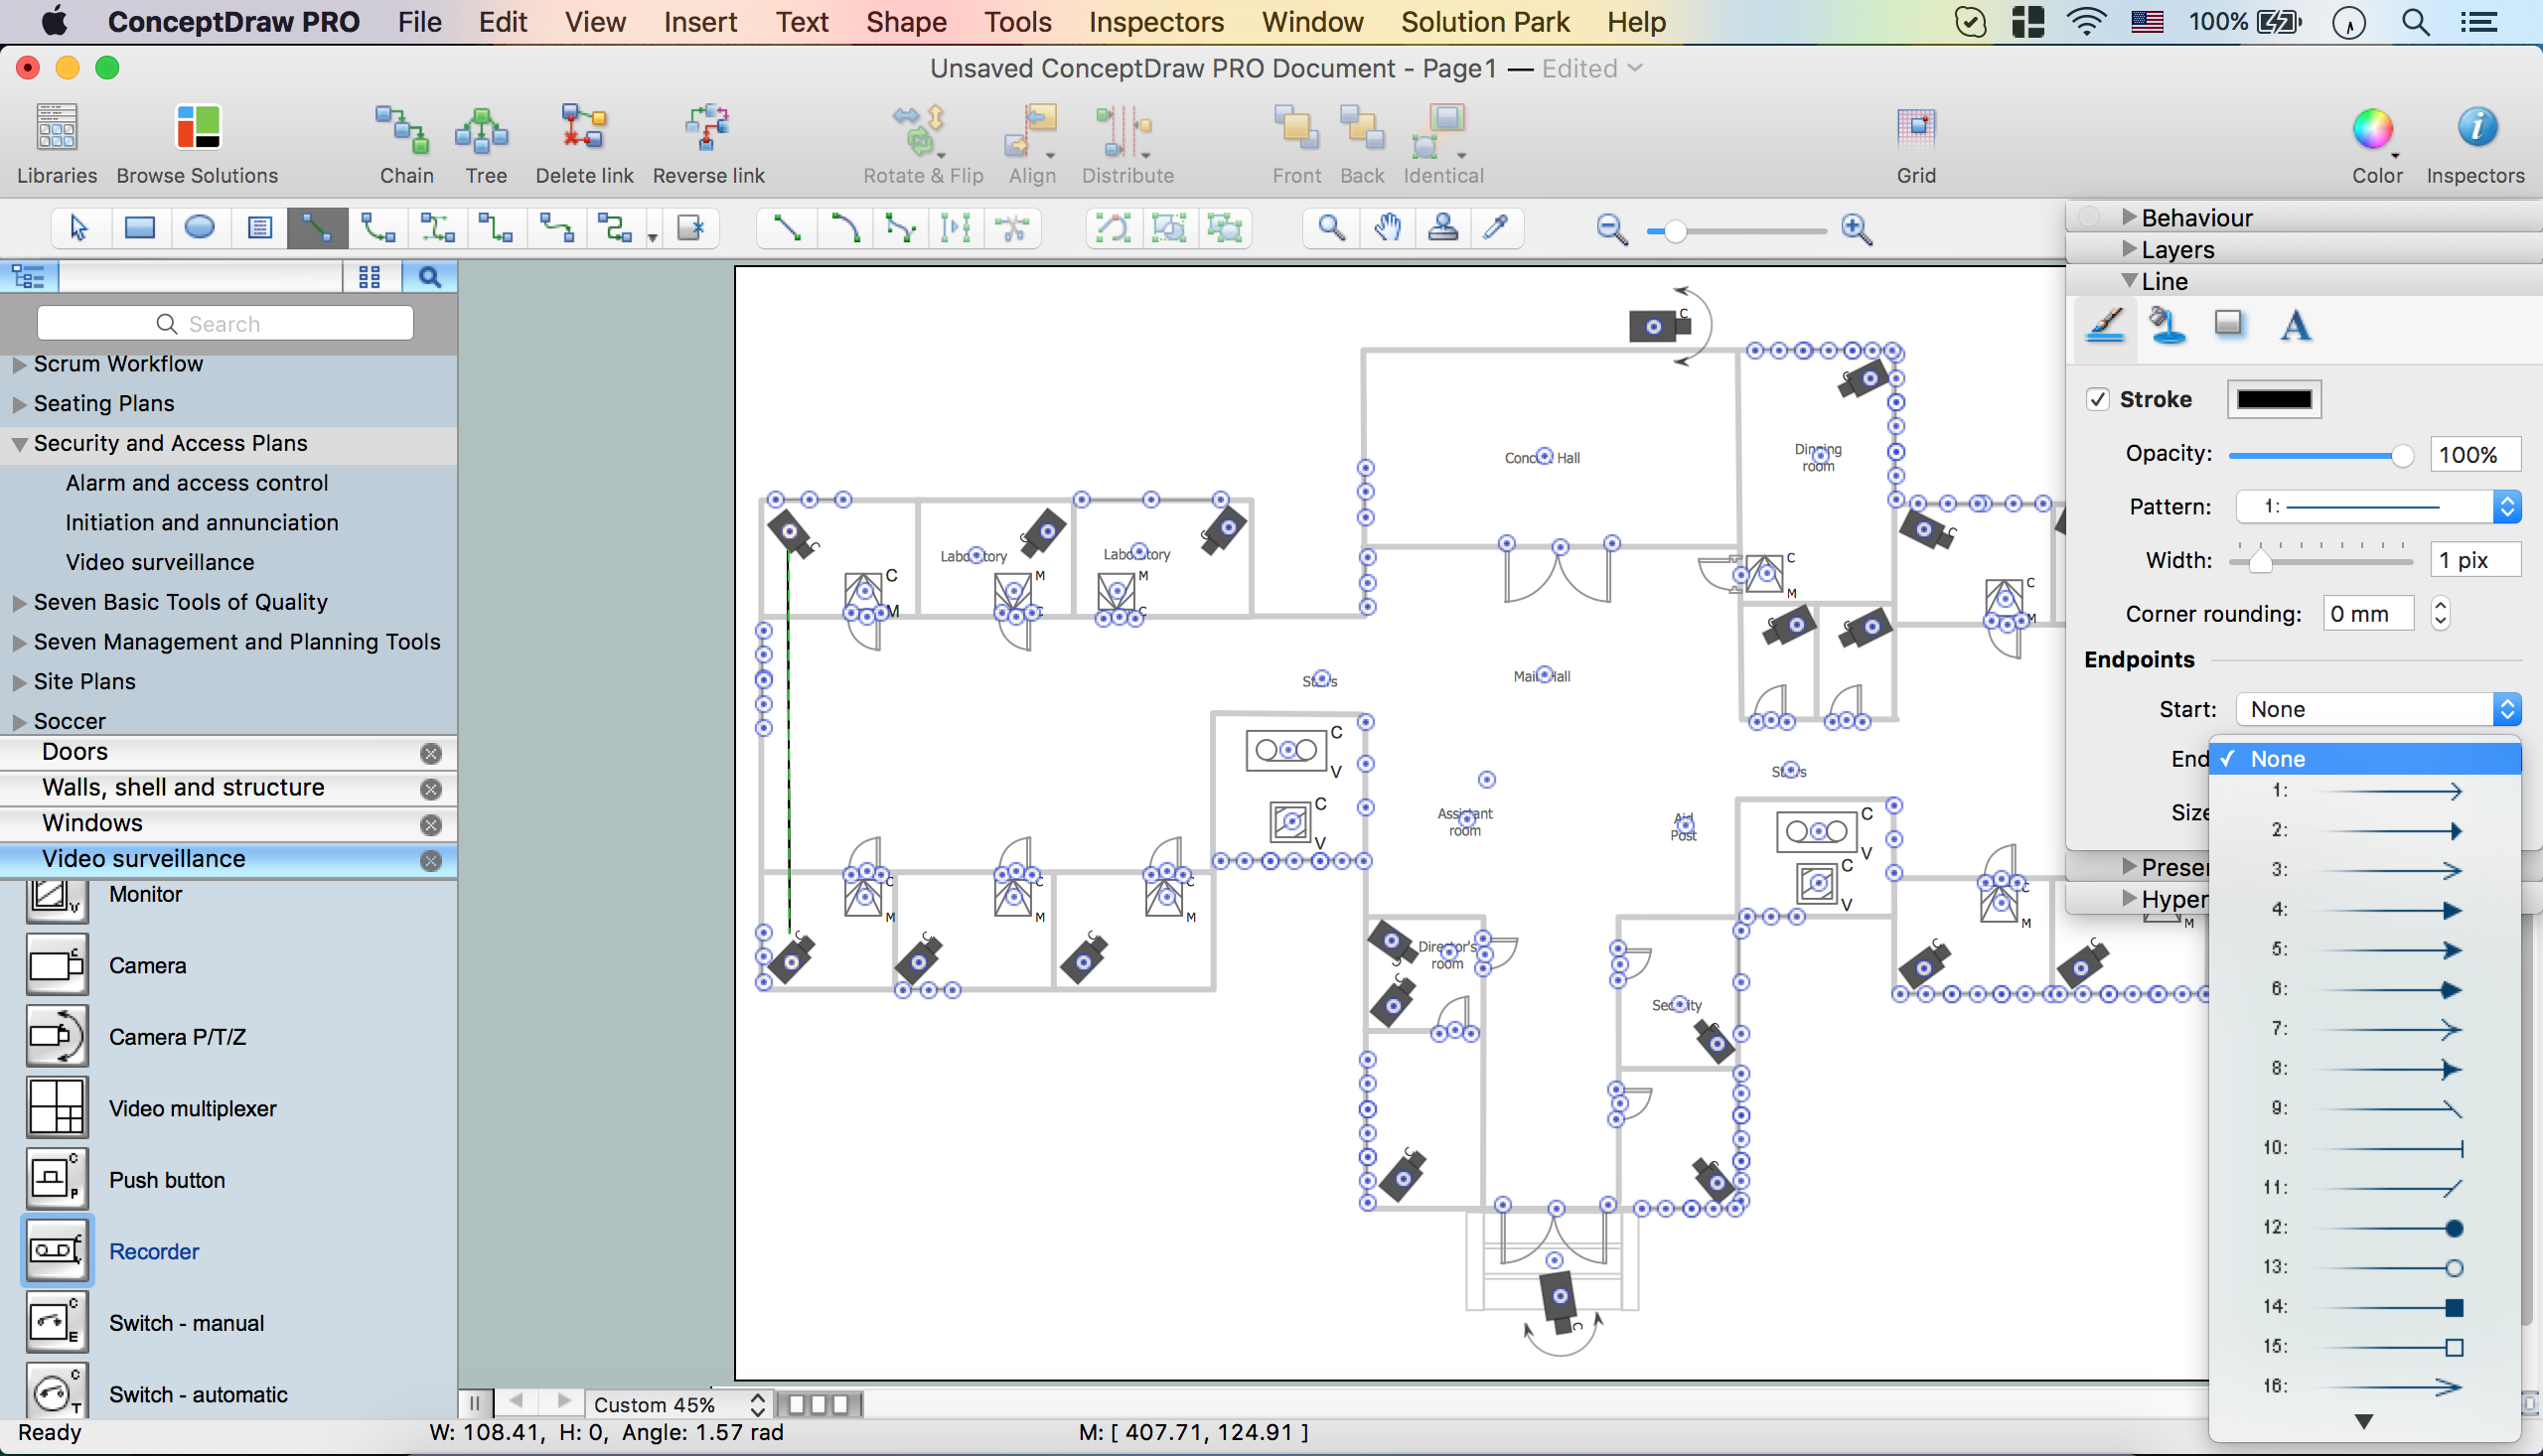
Closed-circuit television (CCTV) uses cameras and monitors to carry out video surveillance. Unlike broadcast television this system has only local signal. It is a feature of almost every video camera, yet CCTV is mainly a system for visual control of certain areas such as banks, airports, supermarkets, and other places for security reasons. Developing and installing CCTV system is a time-consuming process. It also requires certain knowledge and skills. ConceptDraw is a solution of setting video cameras rationally. You can achieve two aims at once: CCTV Design Tool saves your time and your money and helps you make professional video surveillance system.
 Business Diagrams
The Business Diagrams Solution extends ConceptDraw DIAGRAM with an extensive collection of professionally designed illustrative samples and a wide variety of vector stencils libraries, which are the real help for all business-related people, business analysts, business managers, business advisers, marketing experts, PR managers, knowledge workers, scientists, and other stakeholders allowing them to design the bright, neat, expressive and attractive Bubble Diagrams, Circle-Spoke Diagrams, Circular Arrows Diagrams, and Venn Diagrams with different quantity of sets in just minutes; and then successfully use them in documents, reports, statistical summaries, and presentations of any style.
- Entity Relationship Diagrams For Exam Seating Arrangement
- Seating Plans | Electric and Telecom Plans | Entity-Relationship ...
- SWOT Analysis | Seating Plans | Entity-Relationship Diagram ( ERD ...
- Entity-Relationship Diagram ( ERD ) | Google Cloud Platform ...
- Basic Diagramming | ER diagram tool for OS X | Building Drawing ...
- Electrical Symbols, Electrical Diagram Symbols | Seating Plans ...
- ConceptDraw Solution Park | Data Flow Diagrams (DFD) | Baseball ...
- Er Diagram For Indoor Stadium Schedule
- MS Visio Look a Like Diagrams | Flowchart Maker | Seating Plans ...
- Entity-Relationship Diagram ( ERD ) | Education | How to Use Mind ...
- Network Diagram Software. LAN Network Diagrams . Physical Office ...
- Building Drawing Software for Design Seating Plan | Table Seating ...
- Basketball Erd
- Electrical Symbols, Electrical Diagram Symbols | Seating Plans ...
- Concrete Production Plant Flow Chart Diagram
- Network Diagramming Software for Design Rack Diagrams ...
- Emergency Plan | Seating Plans | Home Remodeling Software ...
- ERD Symbols and Meanings | How to Create an Entity-Relationship ...
- Ideal Seating Arrangement For Conducting Network Structured ...
- Entity-Relationship Diagram ( ERD ) | ConceptDraw Solution Park ...


