Entity Relationship Diagram Examples


Entity Relationship Diagram - ERD - Software for Design Crows Foot ER Diagrams
_Win_Mac.png)
IDEF1X Standard

UML Use Case Diagram Example. Registration System

Beauty in nature Illustrations and Clipart

Example of DFD for Online Store (Data Flow Diagram)


 Chen Notation
The Chen Notation solution extends ConceptDraw DIAGRAM software with rich collection of ERD samples and selection of special Chen's notation icons for effective database design, data modeling, and visual representation of relationships between the entities on the ER diagrams designed with Chen notation.
Data Modeling with Entity Relationship Diagram

UML Class Diagram Example - Buildings and Rooms

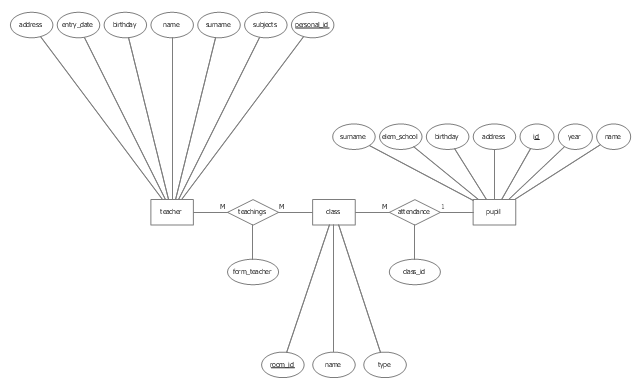
This entity-relationship diagram (ERD) sample shows an entity-relationship model for a school. It was designed on the base of the Wikimedia Commons file: Entity-Relationship-Modell.svg. [commons.wikimedia.org/ wiki/ File:Entity-Relationship-Modell.svg]
"An entity–relationship model (ER model) describes inter-related things of interest in a specific domain of knowledge. An ER model is composed of entity types (which classify the things of interest) and specifies relationships that can exist between instances of those entity types.
In software engineering an ER model is commonly formed to represent things that a business needs to remember in order to perform business processes. Consequently, the ER model becomes an abstract data model that defines a data or information structure that can be implemented in a database, typically a relational database." [Entity–relationship model. Wikipedia]
The Chen's notation ER-diagram example "Entity-relationship model" was created using ConceptDraw PRO software extended with the Chen Notation solution from the Software Development area of ConceptDraw Solution Park.
Chen's ERD
- School Management System ER Diagram
- Entity-Relationship Diagram ( ERD ) | Er Diagram For School ...
- School Management System Erd Diagram
- Er Diagram Example For School Account
- School and Training Plans | Entity-Relationship Diagram ( ERD ...
- Examples Of Erd For School Database
- Er Schema Representation For School Management Database System
- Model Of An Er Diagram Of A School Operations
- ER Digram Of Schools
- Complex Er Diagram Examples