 Illustration Area
Solutions from the Illustrations Area of ConceptDraw Solution Park collect templates, samples and libraries of color scalable vector stencils, icons and clip art for illustrating documents, presentations, infographics, web sites and blogs.
How to Create a Scatter Chart

 ConceptDraw Solution Park
ConceptDraw Solution Park collects graphic extensions, examples and learning materials
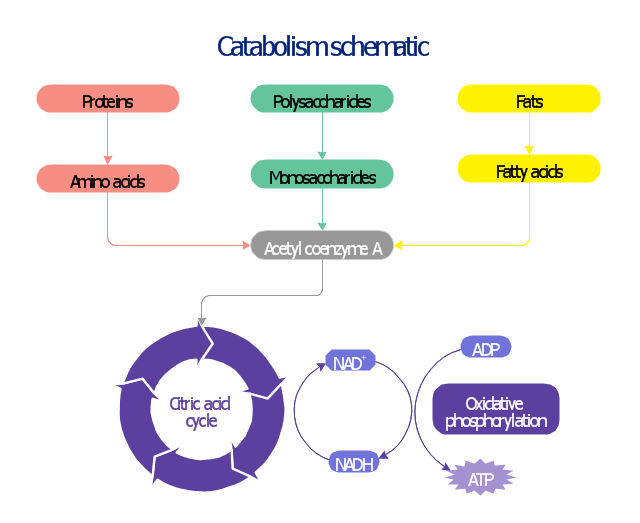
Simplified diagram of catabolism of proteins, carbohydrates and fats.
This biochemical chart display how proteins, polysaccharides and fats from food are digested into gastrointestinal tract into aminoacids, monosaccharides and fatty acids, and then broken down and oxidized to carbon dioxide and water in cellular processes of energy generation.
This metabolic pathway map was redesigned using ConceptDraw PRO diagramming and vector drawing software from Wikipedia file Catabolism schematic.svg [https:/ / en.wikipedia.org/ wiki/ File:Catabolism_ schematic.svg].
This biochemistry diagram example is included in the Biology solution from the Science and Education area of ConceptDraw Solution Park. www.conceptdraw.com/ solution-park/ science-education-biology
Page1
- Manufacturing and Maintenance | Illustration Area | Illustration |
- Manufacturing and Maintenance
- Illustration Area | ConceptDraw Solution Park | Managing the task list |
- Industrial vehicles vector clipart | Design elements - Business ...
- Building Drawing Software for Design Registers, Drills and Diffusers ...
- Manufacturing and Maintenance | LLNL Flow Charts | Citric acid ...
- Biochemical metabolic pathway map diagram | Glycolysis overview ...
- Tools vector clipart | Manufacturing and Maintenance | ConceptDraw ...
- Drawing a Nature Scene | Water Cycle | Nature |
- Physics | Language Learning | Mathematics |
- Biology | Bio Flowchart Lite | Citric acid cycle (TCA cycle) |
- Mathematics | Science and Education Area | Physics |
- ConceptDraw PRO Compatibility with MS Visio | In searching of ...
- Business Diagram Software | Physics | How To Make a Bubble Chart |
- Presentation Clipart | ConceptDraw Solution Park | Business and ...
- Industrial transport - Design elements | Manufacturing and ...
- Glucose catabolism pathways map | Catabolism schematic ...
- Chemistry | Design elements - Chemical elements | Carbonyl ...
- ConceptDraw Solution Park | People | People |