 Electrical Engineering
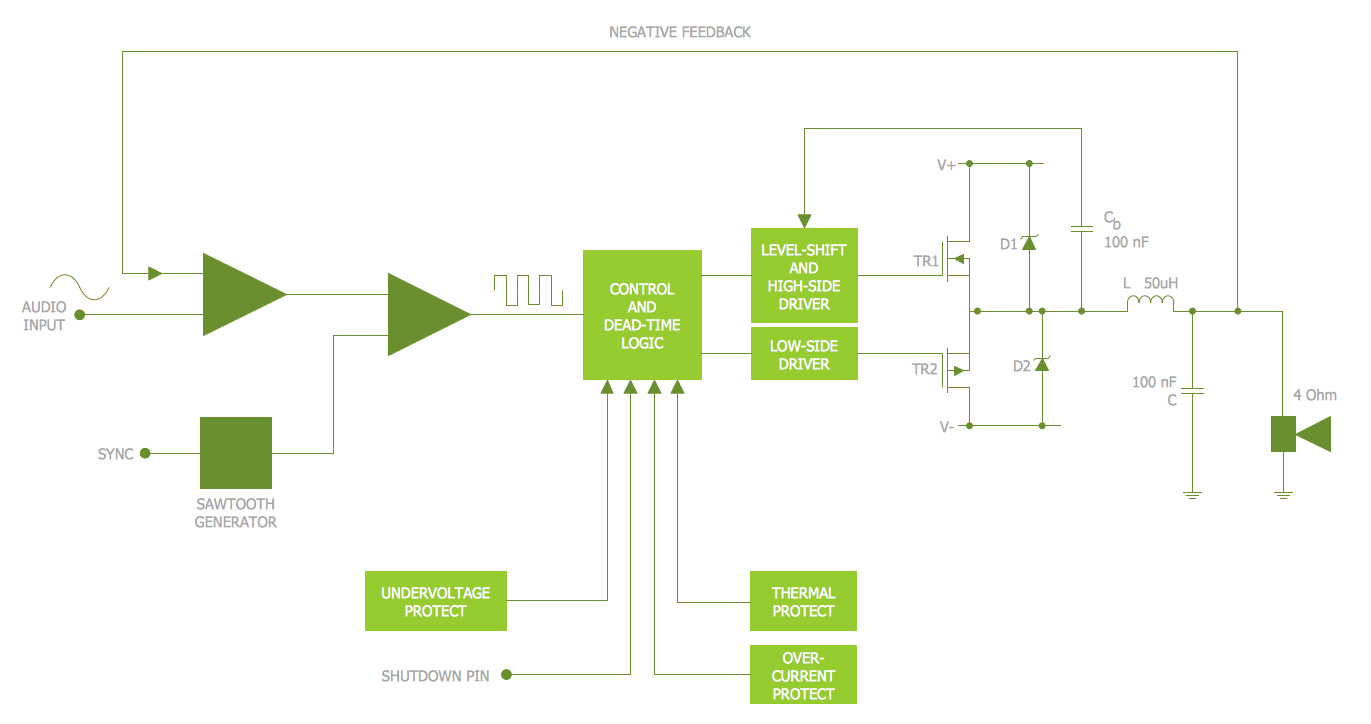
This solution extends ConceptDraw DIAGRAM.9.5 (or later) with electrical engineering samples, electrical schematic symbols, electrical diagram symbols, templates and libraries of design elements, to help you design electrical schematics, digital and analog
Electrical Symbols, Electrical Diagram Symbols

Electrical Diagram
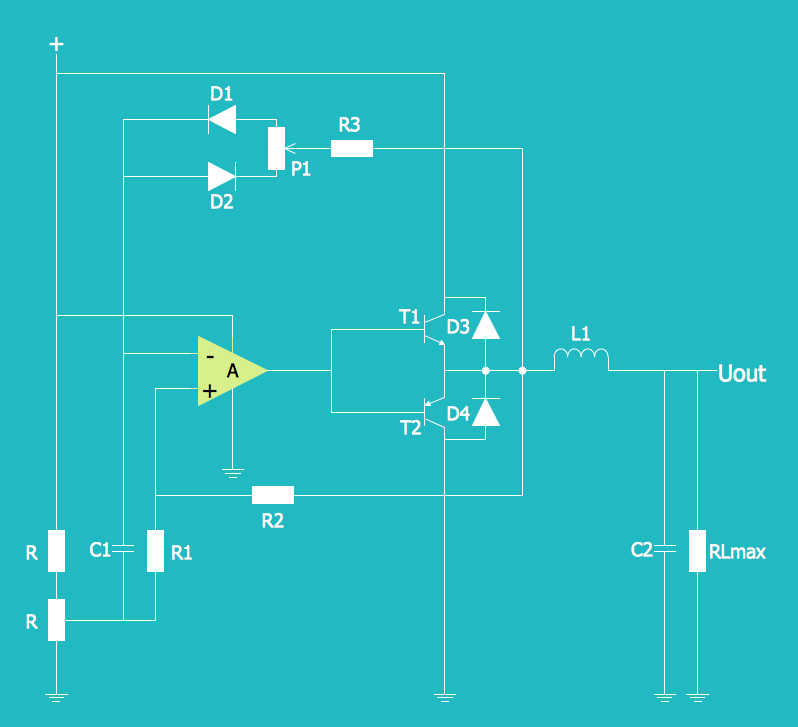
Electrical Schematic
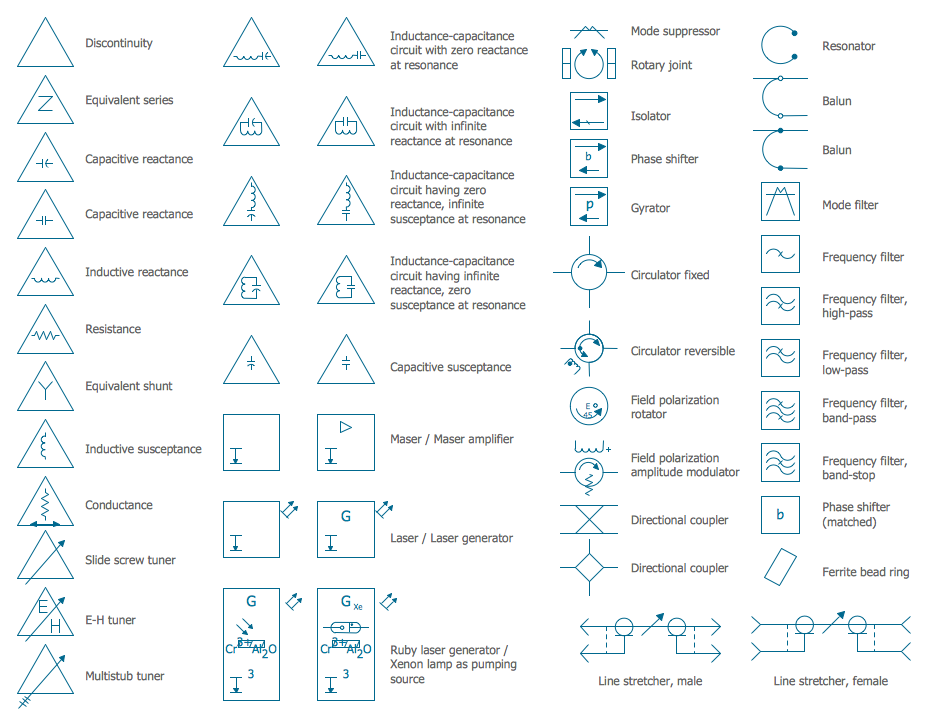
Electrical Symbols — VHF UHF SHF
 Health Food
The Health Food solution contains the set of professionally designed samples and large collection of vector graphic libraries of healthy foods symbols of fruits, vegetables, herbs, nuts, beans, seafood, meat, dairy foods, drinks, which give powerful possi
 Pie Charts
Pie Charts are extensively used in statistics and business for explaining data and work results, in mass media for comparison (i.e. to visualize the percentage for the parts of one total), and in many other fields. The Pie Charts solution for ConceptDraw DIAGRAM offers powerful drawing tools, varied templates, samples, and a library of vector stencils for simple construction and design of Pie Charts, Donut Chart, and Pie Graph Worksheets.
 Sales Flowcharts
The Sales Flowcharts solution lets you create and display sales process maps, sales process workflows, sales steps, the sales process, and anything else involving sales process management.
 iPhone User Interface
iPhone User Interface solution extends ConceptDraw DIAGRAM software with templates, samples and libraries with large quantity of vector stencils of graphical user interface elements, Apps icons, UI patterns for designing and prototyping of the iOS applic
 Presentation Clipart
Presentation design elements solution extends ConceptDraw DIAGRAM software with slide samples, templates and vector stencils libraries with design elements of presentation symbols, arrows, callouts, backgrounds, borders and frames, title blocks.
 Holiday
The Holiday Solution from Illustration area of ConceptDraw Solution Park contains holiday illustration examples, templates and vector clipart library.
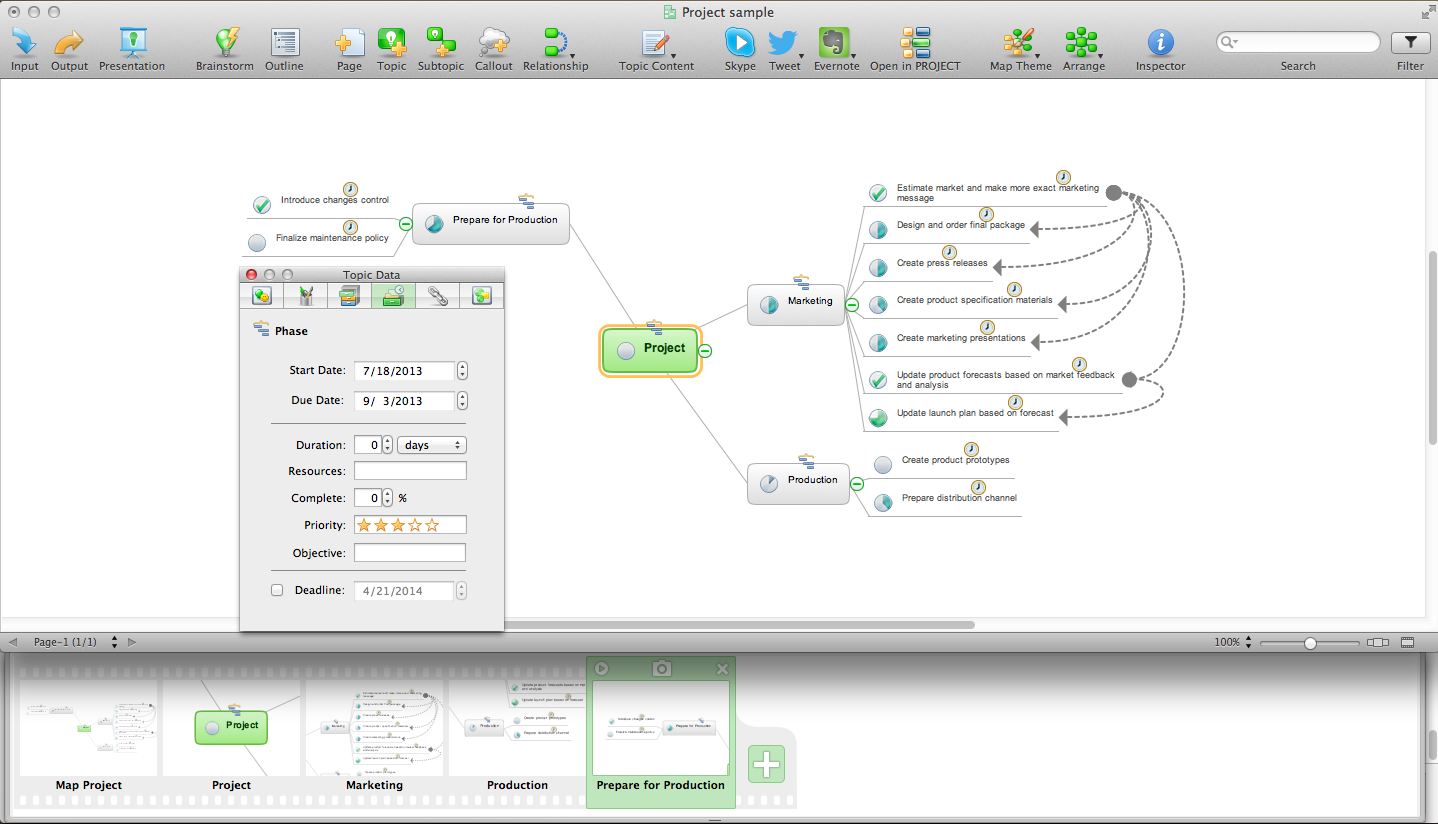
Mind Mapping Software
Process Flow Diagram Symbols

 Cross-Functional Flowcharts
Cross-functional flowcharts are powerful and useful tool for visualizing and analyzing complex business processes which requires involvement of multiple people, teams or even departments. They let clearly represent a sequence of the process steps, the order of operations, relationships between processes and responsible functional units (such as departments or positions).
 Fishbone Diagram
Fishbone Diagrams solution extends ConceptDraw DIAGRAM software with templates, samples and library of vector stencils for drawing the Ishikawa diagrams for cause and effect analysis.
- Professions - Vector stencils library | Electrical Engineering ...
- Electrical Clipart Png
- Electrical Maintenance Tools Clipart Png
- Mechanical Engineering | Electrical Engineering | Competitor ...
- Electrical Symbols — Stations | Cloud clipart - Vector stencils library ...
- HR professions - Vector stencils library | Delivery Boy Clipart Png
- Electrical Symbols — Thermo | Electrical Symbols — Stations | Flow ...
- Electrical Engineer Png
- Objects That Need Electricity Clipart Png
- Cameraman Clip Art Png Hd
- Cleaner Png
- Electronic System Clipart Png
- Electrical Drawing Software and Electrical Symbols | Paint Brush ...
- Environment Officer Clipart Png
- Engineer Illustration Png
- Clipart Electrician Icon
- Pizza Delivery Clipart Png
- Electrical Symbols — Analog and Digital Logic | Entity Relationship ...
- Hotel Plan. Hotel Plan Examples | Electrical Engineering | Dance ...
- Consultant Png