Bar Diagrams for Problem Solving. Create economics and financial bar charts with Bar Graphs Solution

Cylinder Venn Diagram

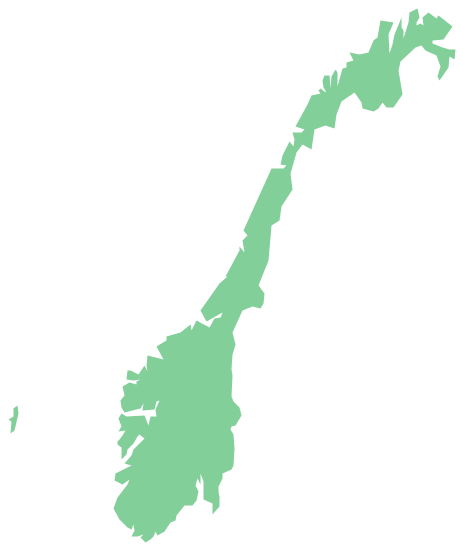
Geo Map - Europe - Norway
 Picture Graphs
Typically, a Picture Graph has very broad usage. They many times used successfully in marketing, management, and manufacturing. The Picture Graphs Solution extends the capabilities of ConceptDraw DIAGRAM with templates, samples, and a library of professionally developed vector stencils for designing Picture Graphs.
 Venn Diagrams
Venn Diagrams are actively used to illustrate simple set relationships in set theory and probability theory, logic and statistics, mathematics and computer science, linguistics, sociology, and marketing. Venn Diagrams are also often used to visually summarize the status and future viability of a project.
Material Requisition Flowchart. Flowchart Examples

 Target and Circular Diagrams
This solution extends ConceptDraw DIAGRAM software with samples, templates and library of design elements for drawing the Target and Circular Diagrams.
 Pie Charts
Pie Charts are extensively used in statistics and business for explaining data and work results, in mass media for comparison (i.e. to visualize the percentage for the parts of one total), and in many other fields. The Pie Charts solution for ConceptDraw DIAGRAM offers powerful drawing tools, varied templates, samples, and a library of vector stencils for simple construction and design of Pie Charts, Donut Chart, and Pie Graph Worksheets.
 Circle-Spoke Diagrams
Examples of subject areas that are well suited to this approach are marketing, business, products promotion, process modeling, market, resource, time, and cost analysis. Circle-Spoke Diagrams are successfully used in presentations, conferences, management documents, magazines, reportages, reviews, reports, TV, and social media.
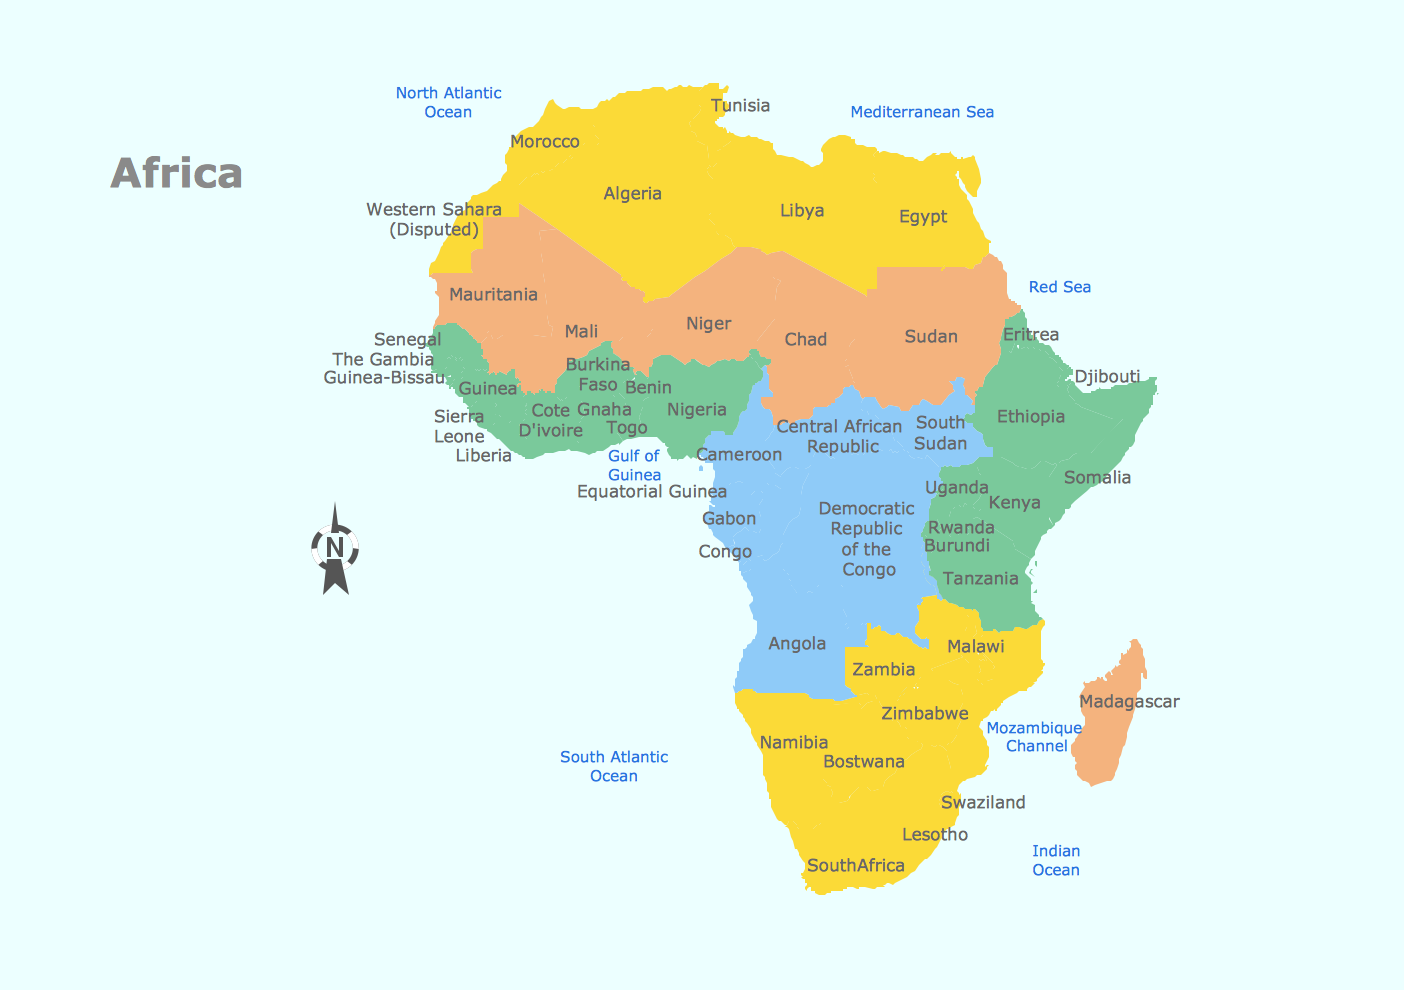
Geo Map - Africa
- Bar Graphs | Sales Growth. Bar Graphs Example | Line Graphs ...
- Picture Graphs | How to Create a Picture Graph in ConceptDraw ...
- Image chart - The total financing of the Philippines from 2001-2010 ...
- Image Of Flowchart Of Form Of Business Organisation
- Barrie population - Picture bar graph | Picture graphs - Vector ...
- Calendars | Bar Graphs | ConceptDraw Solution Park | Using Bar ...
- Sales Growth. Bar Graphs Example | Picture Graphs | Picture Graph ...
- Bar Graph
- Bar Diagrams for Problem Solving. Create economics and financial ...
- Sales Growth. Bar Graphs Example | Line Chart Examples | Basic ...
- Picture Graphs | Sales Growth. Bar Graphs Example | Picture Graph ...
- Basic Flowchart Symbols and Meaning | Flow chart Example ...
- Bar Graphs
- Bar Chart Examples
- Bar Chart Or Bar Graph For Problem Solving
- Graphs and Charts Area | Bar Graphs | Picture Graphs | Charts Graphs
- Bar Diagrams for Problem Solving. Create event management bar ...
- Relative Value Chart Software | Basic Flowchart Images . Flowchart ...
- Chart Examples For Problem Solving
- Pie Chart Image