UML Use Case Diagram Example. Social Networking Sites Project

Example of DFD for Online Store (Data Flow Diagram)


 Funnel Diagrams
Funnel Diagrams solution including wide range of funnel diagram samples, sales funnel examples, and vector design elements, makes the ConceptDraw DIAGRAM ideal for funnel management and creation the Funnel Diagrams of different types and designs, AIDA Model, AIDAS, ACCA Dagmar, Rossiter-Percy Model, Sales funnel, Marketing funnel, Search funnel, Brand funnel, Purchase funnel, Lead funnel, Conversion funnel, Business funnel, etc. You are free to choose to place your funnel object horizontally or vertically, you can use the objects with desired quantity of sales funnel stages, as well as to modify their size, color filling, and other parameters to make exceptionally looking Funnel diagrams fully responding to your desires.
Pyramid Diagram

BPR Diagram. Business Process Reengineering Example

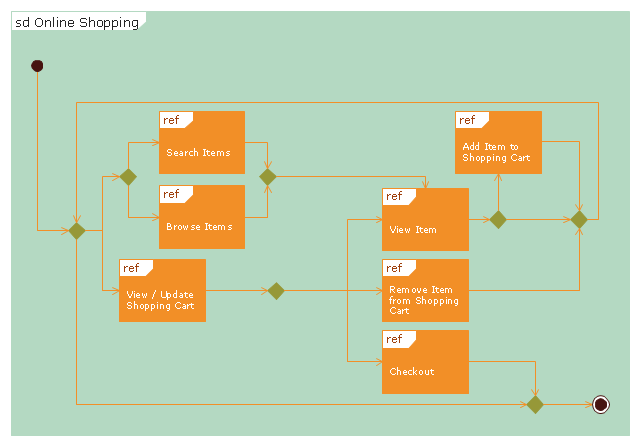
"Online shopping or e-shopping is a form of electronic commerce which allows consumers to directly buy goods or services from a seller over the Internet using a web browser. Alternative names are: e-web-store, e-shop, e-store, Internet shop, web-shop, web-store, online store, online storefront and virtual store. Mobile commerce (or m-commerce) describes purchasing from an online retailer's mobile optimized online site or app.
An online shop evokes the physical analogy of buying products or services at a bricks-and-mortar retailer or shopping center; the process is called business-to-consumer (B2C) online shopping. In the case where a business buys from another business, the process is called business-to-business (B2B) online shopping. The largest of these online retailing corporations are Alibaba, Amazon.com, and eBay. Retail success is no longer all about physical stores. This is evident because of the increase in retailers now offering online store interfaces for consumers. With the growth of online shopping, comes a wealth of new market footprint coverage opportunities for stores that can appropriately cater to offshore market demands and service requirements." [Online shopping. Wikipedia]
The UML interaction overview diagram example "Online shopping" was created using the ConceptDraw PRO diagramming and vector drawing software extended with the Rapid UML solution from the Software Development area of ConceptDraw Solution Park.
UML interaction overview diagram
Fishbone Diagram Problem Solving

Business Process Flow Diagram

 Business Process Diagrams
Business Process Diagrams solution extends the ConceptDraw DIAGRAM BPM software with RapidDraw interface, templates, samples and numerous libraries based on the BPMN 1.2 and BPMN 2.0 standards, which give you the possibility to visualize equally easy simple and complex processes, to design business models, to quickly develop and document in details any business processes on the stages of project’s planning and implementation.
TOWS Matrix

- Data Flow Diagram Of E Commerce Website
- E Commerce Website Data Flow Diagram
- Business Process Diagrams | Office Layout Plans | E Commerce ...
- Workflow Of E Commerce Websites
- Typical Work Flow Diagram For The Design Of E Commerce Site
- Ecommerce Website Business Process
- Dfd Diagrams For Ecommerce Website
- Business Process Diagrams | Business Process Workflow Diagrams ...
- E Commerce Process Flow Chart For App
- Diagram Of Ecommerce Online Shopping Sites