 Seven Management and Planning Tools
Seven Management and Planning Tools solution extends ConceptDraw PRO and ConceptDraw MINDMAP with features, templates, samples and libraries of vector stencils for drawing management mind maps and diagrams.
 Business Productivity Area
Business Productivity Solutions extend ConceptDraw products with tools for making presentations, conducting meetings, preparing documents, brainstorming, or building new strategies.
 Fishbone Diagram
Fishbone Diagrams solution extends ConceptDraw PRO software with templates, samples and library of vector stencils for drawing the Ishikawa diagrams for cause and effect analysis.
 Event-driven Process Chain Diagrams
Event-driven Process Chain (EPC) Diagram is a type of flowchart widely used for modeling in business engineering and reengineering, business process improvement, and analysis. EPC method was developed within the Architecture of Integrated Information Systems (ARIS) framework.
 Entity-Relationship Diagram (ERD)
Entity-Relationship Diagram (ERD) solution extends ConceptDraw PRO software with templates, samples and libraries of vector stencils from drawing the ER-diagrams by Chen's and crow’s foot notations.
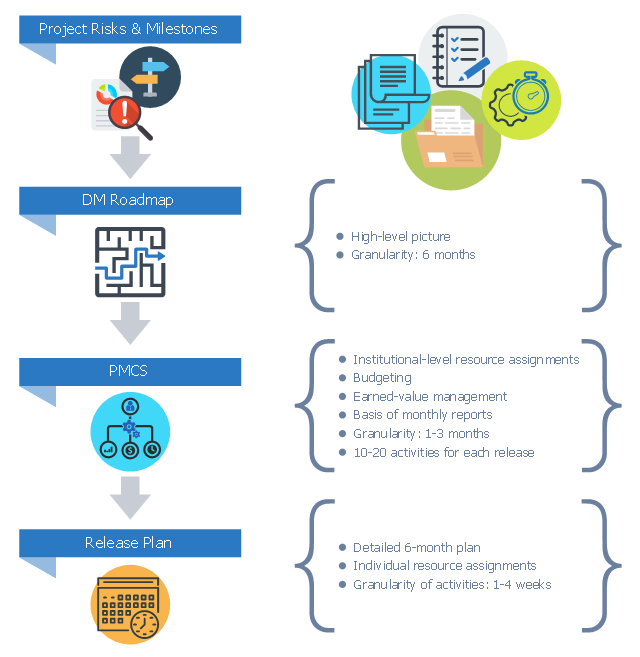
This business infographic sample shows the primary project work plans during research and development (R&D). It was designed on the base of the diagram "Planning Documents Flowdown" from the wiki of the Large Synoptic Survey Telescope (LSST) project.
[dev.lsstcorp.org/ trac/ wiki/ PlanningReportingProcess#DataManagementReportingProcess]
"Research and development (R&D), also known in Europe as research and technical (or technological) development (RTD), is a general term for activities in connection with corporate or governmental innovation. Research and development is a component of Innovation and is situated at the front end of the Innovation life cycle. Innovation builds on R&D and includes commercialization phases." [Research and development. Wikipedia]
The business infographic example "Planning documents flowdown" was designed using ConceptDraw PRO diagramming and vector drawing software extended with the Business and Finance solution from Illustration area of ConceptDraw Solution Park.
Infographic
 ConceptDraw Solution Park
ConceptDraw Solution Park collects graphic extensions, examples and learning materials
- Block diagram - Personal planning process | Create Block Diagram ...
- Seven Management and Planning Tools | Matrices | SWOT analysis ...
- Matrices | Seven Management and Planning Tools | SWOT analysis ...
- CORRECTIVE ACTIONS PLANNING Risk Diagram (PDPC) | Risk ...
- Seven Management and Planning Tools | Fishbone Diagram | Total ...
- CORRECTIVE ACTIONS PLANNING Risk Diagram (PDPC) | Risk ...
- Seven Management and Planning Tools | Entity-Relationship ...
- CORRECTIVE ACTIONS PLANNING PERT Chart | CORRECTIVE ...
- Seven Management and Planning Tools | Business Productivity ...
- Risk Analysis | CORRECTIVE ACTIONS PLANNING Risk Diagram ...
- Pyramid Diagram | Gantt charts for planning and scheduling projects ...
- Seven Management and Planning Tools | Fishbone Diagram | Entity ...
- Block diagram - Personal planning process | Seven Management ...
- Seven Management and Planning Tools | TQM Diagram Example ...
- PROBLEM ANALYSIS Prioritization Matrix | Seven Management and ...
- Seven Management and Planning Tools | Business Productivity ...
- Affinity diagram - Personal activity | Affinity diagram template | Seven ...
- Gantt charts for planning and scheduling projects | Examples of ...
- Corrective Action Planning
- Entity-Relationship Diagram (ERD) | ConceptDraw Solution Park ...