Process Flow Diagram Symbols

This divided bar chart sample shows the petroleum products yielded from 1 barrel of crude oil in California in 2004. It was drawn using data from the chart on the California Energy Almanac website. [energyalmanac.ca.gov/ gasoline/ whats_ in_ barrel_ oil.html]
"Petroleum products are useful materials derived from crude oil (petroleum) as it is processed in oil refineries. Unlike petrochemicals, which are a collection of well-defined usually pure chemical compounds, petroleum products are complex mixtures. The majority of petroleum is converted to petroleum products, which includes several classes of fuels.
According to the composition of the crude oil and depending on the demands of the market, refineries can produce different shares of petroleum products. The largest share of oil products is used as "energy carriers", i.e. various grades of fuel oil and gasoline. These fuels include or can be blended to give gasoline, jet fuel, diesel fuel, heating oil, and heavier fuel oils. Heavier (less volatile) fractions can also be used to produce asphalt, tar, paraffin wax, lubricating and other heavy oils. Refineries also produce other chemicals, some of which are used in chemical processes to produce plastics and other useful materials. Since petroleum often contains a few percent sulfur-containing molecules, elemental sulfur is also often produced as a petroleum product. Carbon, in the form of petroleum coke, and hydrogen may also be produced as petroleum products. The hydrogen produced is often used as an intermediate product for other oil refinery processes such as hydrocracking and hydrodesulfurization." [Petroleum product. Wikipedia]
The chart example "Petroleum products yielded from one barrel of crude oil" was created using the ConceptDraw PRO diagramming and vector drawing software extended with the Divided Bar Diagrams solution from the Graphs and Charts area of ConceptDraw Solution Park.
Divided bar chart

Process Engineering
CAD Software for Architectural Designs
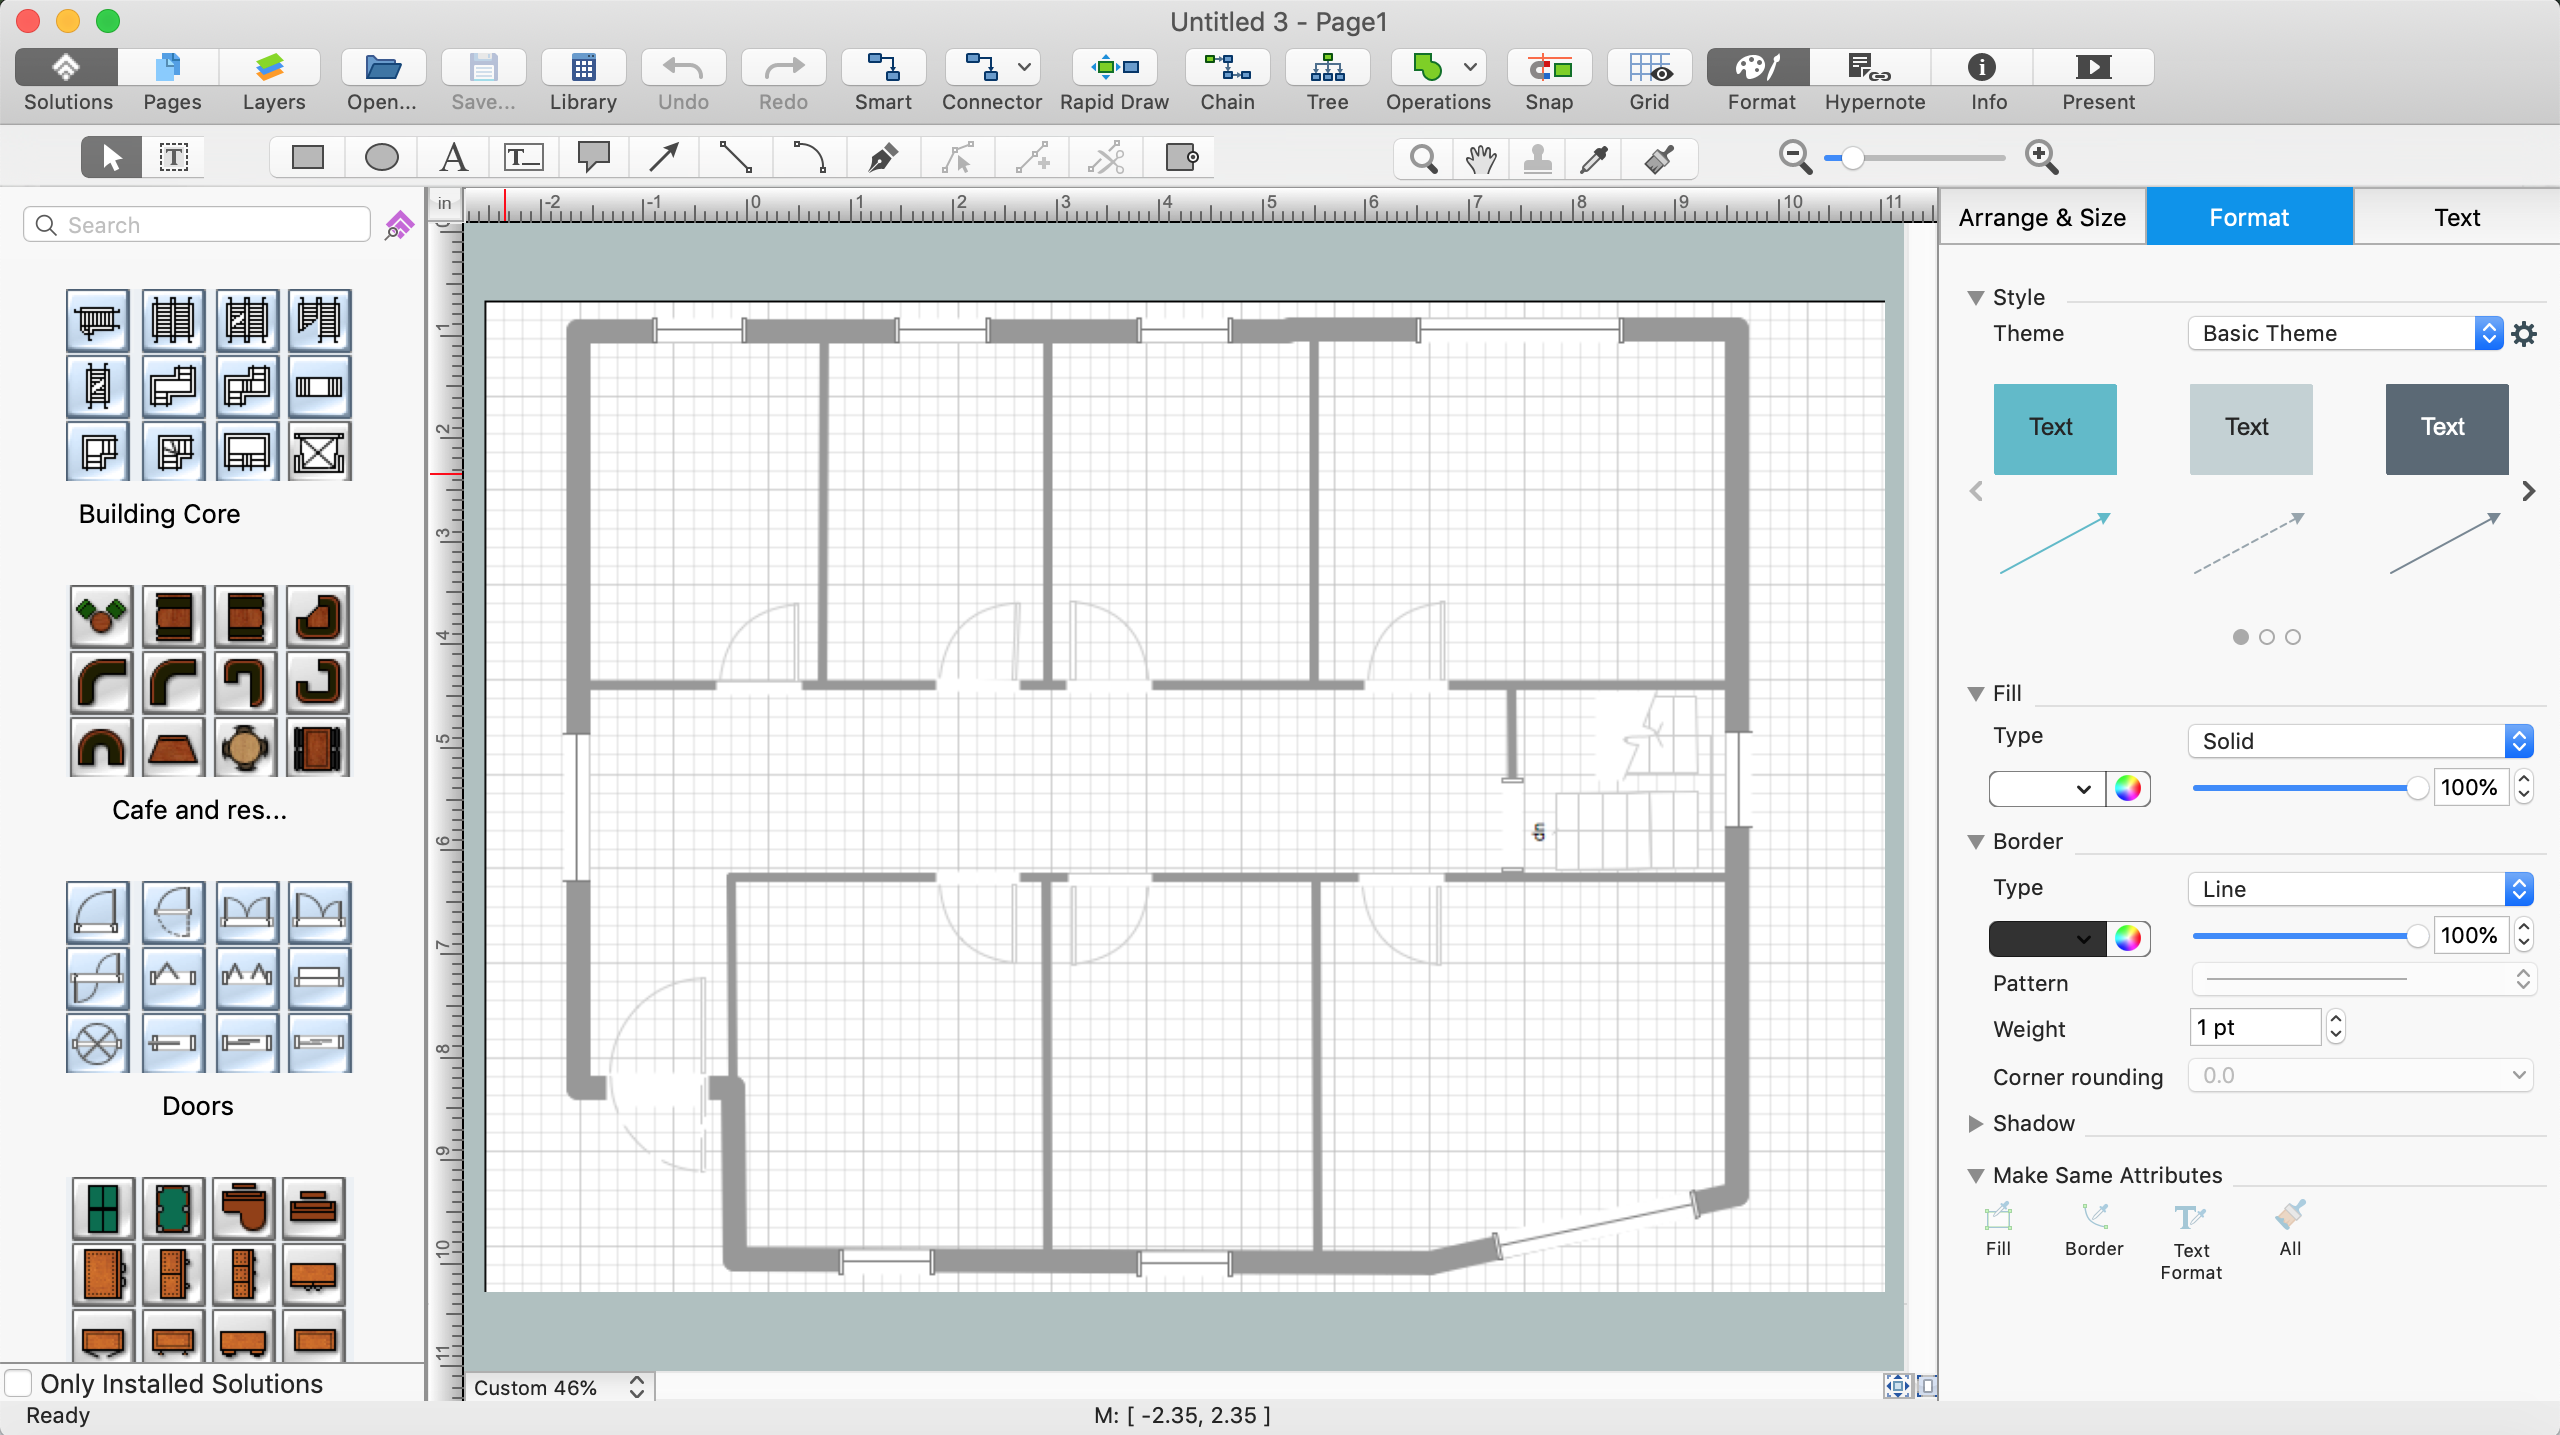
Use the libraries with a set of vector objects, templates and samples from the Floor Plans Solution from the Building Plans area of ConceptDraw Solution Park for designing your professional architectural designs.
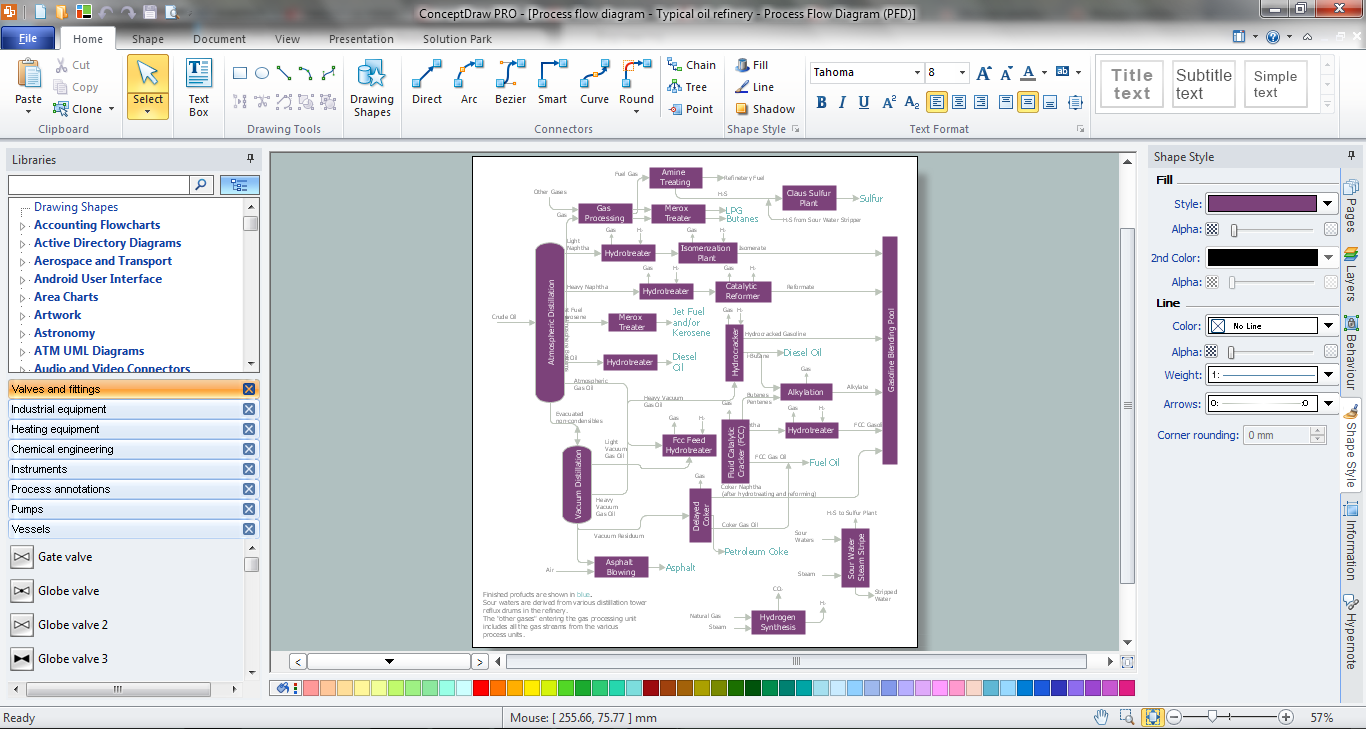
Process Flow Diagram

This process flow diagram (PFD) example shows an amine treating system for the removal of gaseous hydrogen sulfide from gas streams. It is used in oil refineries and chemical plants. This PFD sample was redesigned from the Wikimedia Commons file: AmineTreating.png. [commons.wikimedia.org/ wiki/ File:AmineTreating.png]
This file is licensed under the Creative Commons Attribution-Share Alike 3.0 Unported license. [creativecommons.org/ licenses/ by-sa/ 3.0/ deed.en]
"Amine gas treating, also known as gas sweetening and acid gas removal, refers to a group of processes that use aqueous solutions of various alkylamines (commonly referred to simply as amines) to remove hydrogen sulfide (H2S) and carbon dioxide (CO2) from gases. It is a common unit process used in refineries, and is also used in petrochemical plants, natural gas processing plants and other industries.
Processes within oil refineries or chemical processing plants that remove hydrogen sulfide are referred to as "sweetening" processes because the odor of the processed products is improved by the absence of hydrogen sulfide. An alternative to the use of amines involves membrane technology. Membranes are attractive since no reagents are consumed.
Many different amines are used in gas treating:
Diethanolamine (DEA),
Monoethanolamine (MEA),
Methyldiethanolamine (MDEA),
Diisopropanolamine (DIPA),
Aminoethoxyethanol (Diglycolamine) (DGA).
The most commonly used amines in industrial plants are the alkanolamines DEA, MEA, and MDEA. These amines are also used in many oil refineries to remove sour gases from liquid hydrocarbons such as liquified petroleum gas (LPG)." [Amine gas treating. Wikipedia]
The PFD example "Amine treating unit schematic diagram" was drawn using the ConceptDraw PRO diagramming and vector drawing software extended with the Chemical and Process Engineering solution from the Chemical and Process Engineering area of ConceptDraw Solution Park.
Process Flow Diagram (PFD)
-amine-treating-unit-schematic-diagram.png--diagram-flowchart-example.png)
Fault Tree Analysis Software
Software Work Flow Process in Project Management with Diagram

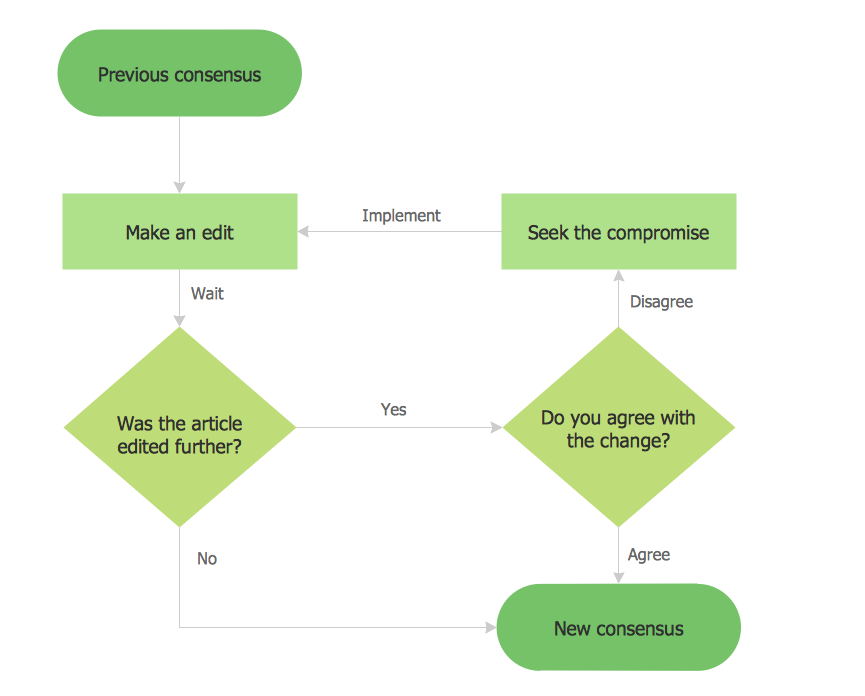
This sample shows the Workflow Diagram that clearly illustrates stages a BPM consists of and relations between all parts of business. The Workflow Diagrams are used to represent the transferring of data during the work process, to study and analysis the working processes, and to optimize a workflow.
Process Flow Chart

Example Basic Flowchart. Flowchart Examples
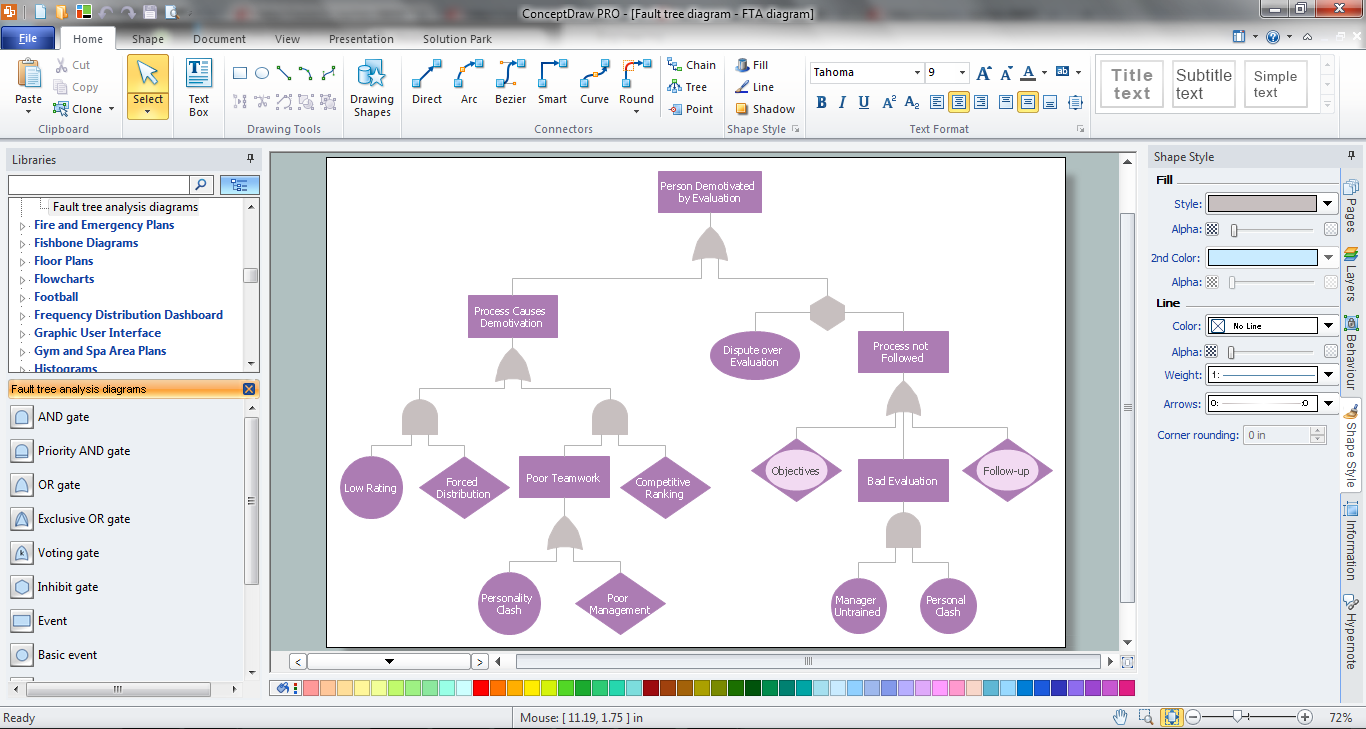
The vector stencils library "Fault tree analysis diagrams" contains 12 symbols for drawing Fault Tree Analysis (FTA) diagrams.
"Fault tree analysis (FTA) is a top down, deductive failure analysis in which an undesired state of a system is analyzed using Boolean logic to combine a series of lower-level events. This analysis method is mainly used in the fields of safety engineering and reliability engineering to understand how systems can fail, to identify the best ways to reduce risk or to determine (or get a feeling for) event rates of a safety accident or a particular system level (functional) failure. FTA is used in the aerospace, nuclear power, chemical and process, pharmaceutical, petrochemical and other high-hazard industries; but is also used in fields as diverse as risk factor identification relating to social service system failure.
In aerospace, the more general term "system Failure Condition" is used for the "undesired state" / Top event of the fault tree. These conditions are classified by the severity of their effects. The most severe conditions require the most extensive fault tree analysis. These "system Failure Conditions" and their classification are often previously determined in the functional Hazard analysis." [Fault tree analysis. Wikipedia]
The shapes example "Fault tree analysis diagrams" was created using the ConceptDraw PRO diagramming and vector drawing software extended with the Fault Tree Analysis Diagrams solution from the Engineering area of ConceptDraw Solution Park.
FTA diagram symbols

Accounting Flowchart Symbols

Flow Chart Online

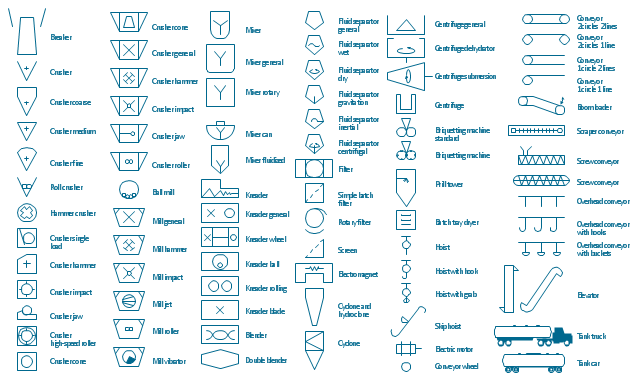
The vector stencils library "Industrial equipment" contains 81 symbols of pumps, compressors, fans, turbines, and power generators.
Use these shapes to design pumping systems, air and fluid compression systems, and industrial process diagrams.
"Process engineering focuses on the design, operation, control, and optimization of chemical, physical, and biological processes. Process engineering encompasses a vast range of industries, such as chemical, petrochemical, mineral processing, advanced material, food, pharmaceutical, and biotechnological industries. The application of systematic computer-based methods to process engineering is process systems engineering." [Process engineering. Wikipedia]
The example "Design elements - Industrial equipment" was created using the ConceptDraw PRO diagramming and vector drawing software extended with the Chemical and Process Engineering solution from the Engineering area of ConceptDraw Solution Park.
Industrial equipment symbols
- Building Drawing Software for Design Site Plan | Chemicals And ...
- Petrochemical Industry Wih Help Of Process Flow Diagram
- Natural Gas To Petrochemical Process Flow Diagram
- Process Flow Diagram | Process Diagrams | Petrochemical Unit ...
- Petrochemical Flowchart
- Fault Tree Analysis Software | Chemical And Petrochemicals ...
- Petrochemical Engineering Equipment
- Sketch The Chart Of Petrochemical
- Petrochemical Enggnerig Symbols
- Unit Operation Used In Petrochemical Industry With Help Of Process
- Refinery Petrochemical Scheme
- Chemical And Petrochemicals Schematic Diagram
- Petrochemical Refinery Flow Chart
- Building Drawing Software for Design Site Plan | Piping and ...
- Welding Design Of Petrochemical Parts
- Vector Petrochemical Tanks
- Crude oil distillation unit - PFD | Natural gas condensate - PFD ...
- Plant Layout Plans | Onion Diagram Process Design | Process flow ...
- Chemical and Process Engineering | How to Draw a Chemical ...
- How to Draw a Divided Bar Chart in ConceptDraw PRO | Divided ...