Root Cause Tree Diagram

Pie Chart Word Template. Pie Chart Examples

 Fault Tree Analysis Diagrams
This solution extends ConceptDraw DIAGRAM.5 or later with templates, fault tree analysis example, samples and a library of vector design elements for drawing FTA diagrams (or negative analytical trees), cause and effect diagrams and fault tree diagrams.
Line Chart Template for Word

Venn Diagram Template for Word

HelpDesk
How to Create an Active Directory Diagram

Looking at ConceptDraw MINDMAP as a Replacement for Mindjet Mindmanager

Process Flowchart


 Family Tree
Family Tree solution with included vector design shapes for drawing family trees, pedigree chart symbols, photo blocks of different detailing and professionally designed samples, extends the functionality of ConceptDraw DIAGRAM software making it the best family tree maker and easy-to-use ancestry trees designer program for researchers, scientists, historians, genetics, medics, archeologists, and other stakeholders. Use it to design informative and colorful genealogy trees, simple family tree or extensive ancestry tree of any depth, genealogy schematics and illustrations with family trees.
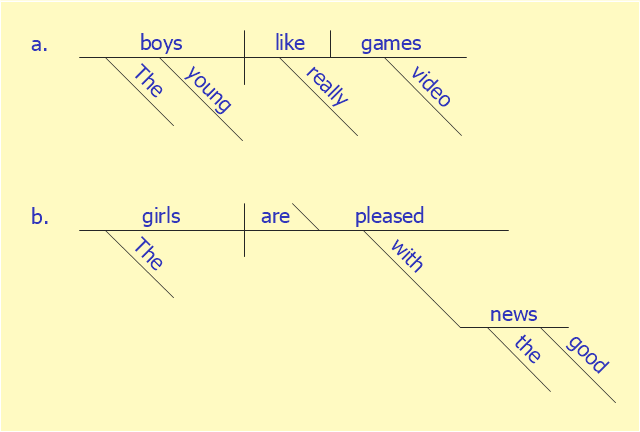
This sentence diagram example was redesigned from the Wikipedia file: Examples of Reed-Kellogg diagrams.jpg.
[en.wikipedia.org/ wiki/ File:Examples_ of_ Reed-Kellogg_ diagrams.jpg]
This file is licensed under the Creative Commons Attribution-Share Alike 3.0 Unported license. [creativecommons.org/ licenses/ by-sa/ 3.0/ deed.en]
"Most methods of diagramming in pedagogy are based on the work of Alonzo Reed and Brainerd Kellogg in their book Higher Lessons in English, first published in 1877, though the method has been updated with recent understanding of grammar. Reed and Kellogg were preceded, and their work probably informed, by W. S. Clark, who published his "balloon" method of depicting grammar in his 1847 book A Practical Grammar: In Which Words, Phrases & Sentences are Classified According to Their Offices and Their Various Relationships to Each Another.
Some schoolteachers continue to use the Reed-Kellogg system in teaching grammar, but others have discouraged it in favor of more modern tree diagrams. However, these modern tree structures draw on techniques that were already present in Reed-Kellogg diagrams. Reed and Kellogg defend their system in the preface to their grammar:
The Objections to the Diagram. - The fact that the pictorial diagram groups the parts of a sentence according to their offices and relations, and not in the order of speech, has been spoken of as a fault. It is, on the contrary, a merit, for it teaches the pupil to look through the literary order and discover the logical order. He thus learns what the literary order really is, and sees that this may be varied indefinitely, so long as the logical relations are kept clear.
The assertion that correct diagrams can be made mechanically is not borne out by the facts. It is easier to avoid precision in oral analysis than in written. The diagram drives the pupil to a most searching examination of the sentence, brings him face to face with every difficulty, and compels a decision on every point.
These statements bear witness to the fact that Reed-Kellogg diagrams abstract away from actual word order in order to focus more intently on how words in sentences function and relate to each other." [Sentence diagram. Wikipedia]
The examples of Reed-Kellogg diagrams was created using the ConceptDraw PRO diagramming and vector drawing software extended with the Language Learning solution from the Science and Education area of ConceptDraw Solution Park.
Sentence diagram
- Fault Tree Analysis Diagrams | Word Exchange | Sport Field Plans ...
- How to Create a Fault Tree Analysis Diagram (FTD) in ConceptDraw ...
- Affinity Diagram | Affinity Diagram | Root Cause Tree Diagram ...
- Tree Diagram Of Types Of Communication
- Problem Tree Template Word
- Communication medium diagram | Communication Tree Diagram
- Wireless Network Drawing | Business Process Elements: Swimlanes ...
- English Tree Diagram
- Fault Tree Analysis Template Word
- How To Create An Affinity Diagram In Word