HelpDesk
How to Create a Fault Tree Analysis Diagram (FTD) in ConceptDraw PRO

The vector stencils library "Fault tree analysis diagrams" contains 12 symbols for drawing FTA diagrams in the ConceptDraw PRO diagramming and vector drawing software extended with the Fault Tree Analysis Diagrams solution from the Engineering area of ConceptDraw Solution Park.
www.conceptdraw.com/ solution-park/ engineering-fault-tree-analysis-diagrams
www.conceptdraw.com/ solution-park/ engineering-fault-tree-analysis-diagrams
AND gate

Priority AND gate

OR gate

Inhibit gate

XOR gate

Event

Basic event

Undeveloped event

House event

Conditional event

Transfer symbol

Voting gate

The vector stencils library "Fault tree analysis diagrams" contains 12 symbols for drawing Fault Tree Analysis (FTA) diagrams.
"Fault tree analysis (FTA) is a top down, deductive failure analysis in which an undesired state of a system is analyzed using Boolean logic to combine a series of lower-level events. This analysis method is mainly used in the fields of safety engineering and reliability engineering to understand how systems can fail, to identify the best ways to reduce risk or to determine (or get a feeling for) event rates of a safety accident or a particular system level (functional) failure. FTA is used in the aerospace, nuclear power, chemical and process, pharmaceutical, petrochemical and other high-hazard industries; but is also used in fields as diverse as risk factor identification relating to social service system failure.
In aerospace, the more general term "system Failure Condition" is used for the "undesired state" / Top event of the fault tree. These conditions are classified by the severity of their effects. The most severe conditions require the most extensive fault tree analysis. These "system Failure Conditions" and their classification are often previously determined in the functional Hazard analysis." [Fault tree analysis. Wikipedia]
The shapes example "Fault tree analysis diagrams" was created using the ConceptDraw PRO diagramming and vector drawing software extended with the Fault Tree Analysis Diagrams solution from the Engineering area of ConceptDraw Solution Park.
FTA diagram symbols

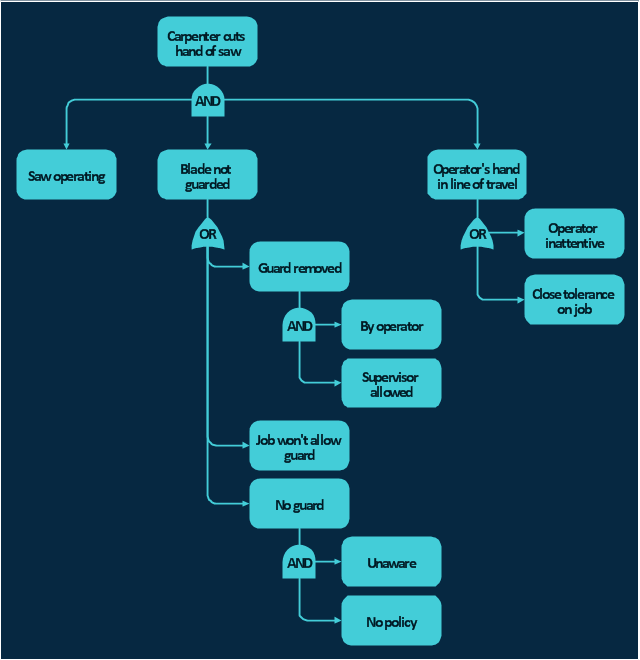
The FTA diagram example "Hazard analysis" was redesigned from the illustration of the article "Hazard Analysis Methodologies" from the Occupational Safety & Health Administration (OSHA) website.
"A fault tree analysis is a quantitative assessment of all of the undesirable outcomes, such as a toxic gas release or explosion, which could result from a specific initiating event. It begins with a graphic representation (using logic symbols) of all possible sequences of events that could result in an incident. The resulting diagram looks like a tree with many branches — each branch listing the sequential events (failures) for different independent paths to the top event. Probabilities (using failure rate data) are assigned to each event and then used to calculate the probability of occurrence of the undesired event. ...
This technique is particularly useful in evaluating the effect of alternative actions on reducing the probability of occurrence of the undesired event."
[osha.gov/ SLTC/ etools/ safetyhealth/ mod4_ tools_ methodologies.html]
The FTA diagram example "Hazard analysis" was created using the ConceptDraw PRO diagramming and vector drawing software extended with the Fault Tree Analysis Diagrams solution from the Engineering area of ConceptDraw Solution Park.
FTA diagram
Fault tree analysis diagrams solution extends ConceptDraw PRO software with templates, samples and library of vector stencils for drawing the FTA diagrams.
Fault Tree
Workflow
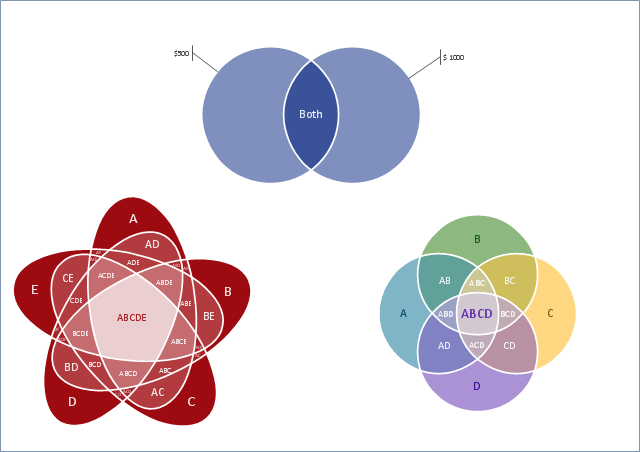
Cash Venn
Used Solutions
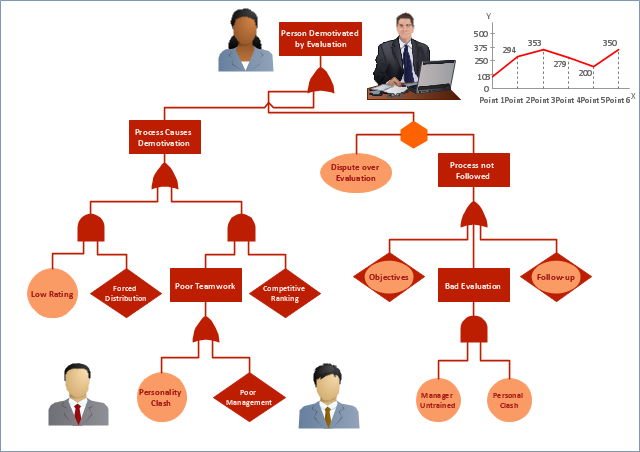
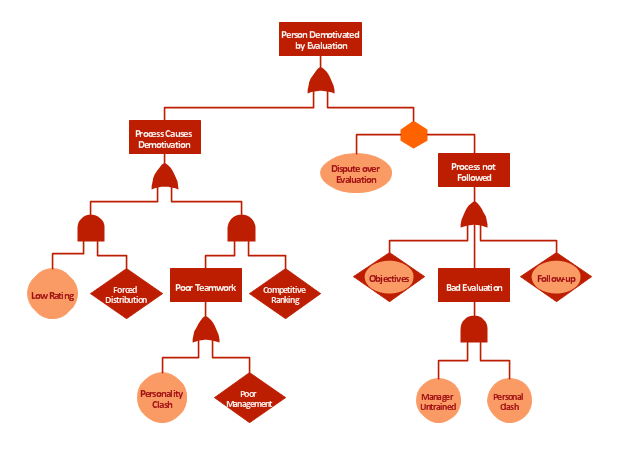
"Subjective performance evaluation allows the use of a subtler, more balanced assessment of employee performance, and is typically used for more complex jobs where comprehensive objective measures are difficult to specify and/ or measure. Whilst often the only feasible method, the attendant problems with subjective performance evaluation have resulted in a variety of incentive structures and supervisory schemes. One problem, for example, is that supervisors may under-report performance in order to save on wages, if they are in some way residual claimants, or perhaps rewarded on the basis of cost savings. This tendency is of course to some extent offset by the danger of retaliation and/ or demotivation of the employee, if the supervisor is responsible for that employee’s output. ...
Another problem relates to what is known as the "compression of ratings". Two related influences—centrality bias, and leniency bias—have been documented ... The former results from supervisors being reluctant to distinguish critically between workers (perhaps for fear of destroying team spirit), while the latter derives from supervisors being averse to offering poor ratings to subordinates, especially where these ratings are used to determine pay, not least because bad evaluations may be demotivating rather than motivating. However, these biases introduce noise into the relationship between pay and effort, reducing the incentive effect of performance-related pay. ... this is the reason for the common separation of evaluations and pay, with evaluations primarily used to allocate training.
Finally, while the problem of compression of ratings originates on the supervisor-side, related effects occur when workers actively attempt to influence the appraisals supervisors give, either by influencing the performance information going to the supervisor: multitasking (focussing on the more visibly productive activities...), or by working “too hard” to signal worker quality or create a good impression...; or by influencing the evaluation of it, e.g., by "currying influence"... or by outright bribery..." [Principal–agent problem. Wikipedia]
The example "Person demotivated by evaluation - Fault tree analysis diagram" was created using the ConceptDraw PRO diagramming and vector drawing software extended with the Fault Tree Analysis Diagrams solution from the Engineering area of ConceptDraw Solution Park.
FTA diagram
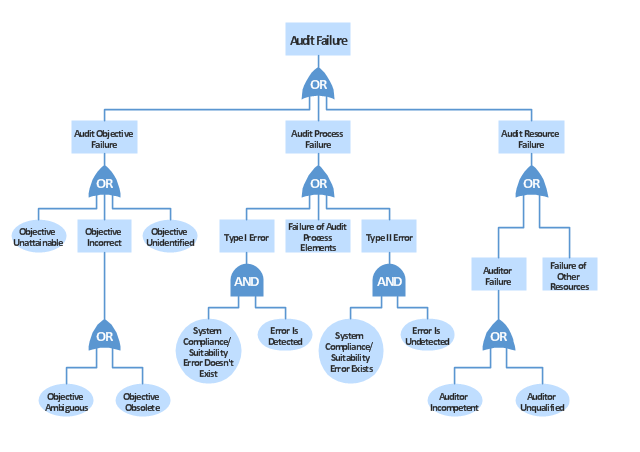
"Failure analysis is the process of collecting and analyzing data to determine the cause of a failure. It is an important discipline in many branches of manufacturing industry, such as the electronics industry, where it is a vital tool used in the development of new products and for the improvement of existing products. There are many companies which provide services to find the cause of failure in products, devices and in post disaster situations. The failure analysis process relies on collecting failed components for subsequent examination of the cause or causes of failure using a wide array of methods, especially microscopy and spectroscopy. The NDT or nondestructive testing methods (such as Industrial computed tomography scanning) are valuable because the failed products are unaffected by analysis, so inspection always starts using these methods." [Failure analysis. Wikipedia]
The example "Audit failure - Fault tree analysis diagram" was created using the ConceptDraw PRO diagramming and vector drawing software extended with the Fault Tree Analysis Diagrams solution from the Engineering area of ConceptDraw Solution Park.
The example "Audit failure - Fault tree analysis diagram" was created using the ConceptDraw PRO diagramming and vector drawing software extended with the Fault Tree Analysis Diagrams solution from the Engineering area of ConceptDraw Solution Park.
FTA diagram
This example was redesigned from the Wikimedia Commons file: Example of High Level Fault Tree.jpg. [commons.wikimedia.org/ wiki/ File:Example_ of_ High_ Level_ Fault_ Tree.jpg]
"Risk assessment is the determination of quantitative or qualitative value of risk related to a concrete situation and a recognized threat (also called hazard). Quantitative risk assessment requires calculations of two components of risk (R):, the magnitude of the potential loss (L), and the probability (p) that the loss will occur. Acceptable risk is a risk that is understood and tolerated usually because the cost or difficulty of implementing an effective countermeasure for the associated vulnerability exceeds the expectation of loss.
In all types of engineering of complex systems sophisticated risk assessments are often made within Safety engineering and Reliability engineering when it concerns threats to life, environment or machine functioning. The nuclear, aerospace, oil, rail and military industries have a long history of dealing with risk assessment. Also, medical, hospital, social service and food industries control risks and perform risk assessments on a continual basis. Methods for assessment of risk may differ between industries and whether it pertains to general financial decisions or environmental, ecological, or public health risk assessment." [Risk assessment. Wikipedia]
The FTA diagram example "High level fault tree" was created using the ConceptDraw PRO diagramming and vector drawing software extended with the Fault Tree Analysis Diagrams solution from the Engineering area of ConceptDraw Solution Park.
FTA diagram

- FTA diagram - Hazard analysis | Accident analytic tree - FTA ...
- Design elements - Fault tree analysis diagrams | Fault Tree Diagram ...
- Fault tree analysis diagram template | Graphics Software for ...
- Fault Tree Analysis Diagrams | Design elements - Fault tree analysis ...
- Logic gate diagram - Template
- Fault Tree Diagram Software
- Fault Tree Analysis Diagrams
- Audit failure - Fault tree analysis diagram | Design elements - Fault ...
- Graphics Software for Business | PROBLEM ANALYSIS Root Cause ...
- Basic Flowchart Symbols and Meaning | Fault tree analysis ...
- Design elements - Fault tree analysis diagrams | Design elements ...
- Fault tree analysis diagram
- FTA diagram - Hazard analysis | Design elements - Fault tree ...
- Fault Tree Analysis Diagrams | Seven Management and Planning ...
- Fault tree analysis diagrams
- Fault Tree Analysis Diagrams | Tree Network Topology Diagram ...
- Fault tree analysis diagram
- FTA diagram - Hazard analysis | Design elements - Fire and ...
- How to Create a Fault Tree Analysis Diagram (FTD) in ConceptDraw ...
- Fault Tree Analysis Diagrams | Root cause analysis tree diagram ...