The vector stencils library "Travel and tourism pictograms" contains 20 travelling and journey symbols.
Use it to draw your tour and trip infograms. The example "Travel and tourism pictograms - Vector stencils library" was created using the ConceptDraw PRO diagramming and vector drawing software extended with the Pictorial infographics solution from the area "What is infographics" in ConceptDraw Solution Park.
Use it to draw your tour and trip infograms. The example "Travel and tourism pictograms - Vector stencils library" was created using the ConceptDraw PRO diagramming and vector drawing software extended with the Pictorial infographics solution from the area "What is infographics" in ConceptDraw Solution Park.
Globe

Wind rose

Direction

Sign

Milestone

Flag

Campground

Tent

RV

Restaurant

Restrooms

Passport

Plane

Ticket

Briefcase

Case

Luggage

Mountains

Palm

Hotel

 Business Process Diagrams
Business Process Flow Diagrams solution extends the ConceptDraw DIAGRAM BPM software with RapidDraw interface, templates, business process diagrams examples and numerous libraries based on the BPMN 1.2 and BPMN 2.0 standards, which give you the possibility to visualize equally easy simple and complex processes, to design business models, to quickly develop and document in details any business processes on the stages of project’s planning and implementation.
The vector stencils library "Travel and tourism pictograms" contains 20 travelling and journey symbols.
Use it to draw your tour and trip infograms. The example "Travel and tourism pictograms - Vector stencils library" was created using the ConceptDraw PRO diagramming and vector drawing software extended with the Pictorial infographics solution from the area "What is infographics" in ConceptDraw Solution Park.
Use it to draw your tour and trip infograms. The example "Travel and tourism pictograms - Vector stencils library" was created using the ConceptDraw PRO diagramming and vector drawing software extended with the Pictorial infographics solution from the area "What is infographics" in ConceptDraw Solution Park.
Globe
Wind rose
Direction
Sign
Milestone
Flag
Campground
Tent
RV
Restaurant
Restrooms
Passport
Plane
Ticket
Briefcase
Case
Luggage
Mountains
Palm
Hotel
Design Pictorial Infographics. Design Infographics

Infographic Maker

 Directional Maps
Directional Maps solution extends ConceptDraw DIAGRAM software with templates, samples and libraries of vector stencils for drawing the directional, location, site, transit, road and route maps, plans and schemes.
 Customer Journey Mapping
Customer Journey Mapping Solution for ConceptDraw DIAGRAM opens incredibly broad opportunities for marketing and business specialists, product managers, designers, engineers, and other people interested in business development, increasing the product’s audience, its success and users' demand, providing them with capabilities of customer journey mapping. The included diagramming and customer journey mapping tools, predesigned vector customer journey mapping icons and charts, consumer journey mapping connectors, user journey and customer mapping figures, customer experience map icons and touchpoint icons, quick-start templates and samples provide excellent conditions for the customer journey mapping process, for creating Customer Journey Map and Customer Experience Map.
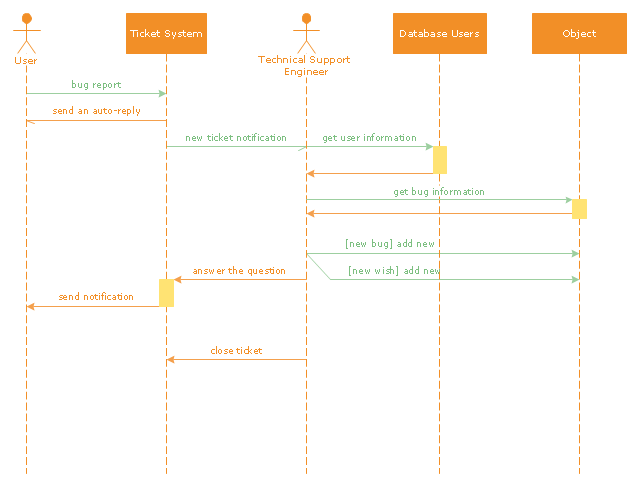
"An example scenario is presented to demonstrate how a common issue tracking system would work:
(1) A customer service technician receives a telephone call, email, or other communication from a customer about a problem. Some applications provide built-in messaging system and automatic error reporting from exception handling blocks.
(2) The technician verifies that the problem is real, and not just perceived. The technician will also ensure that enough information about the problem is obtained from the customer. This information generally includes the environment of the customer, when and how the issue occurs, and all other relevant circumstances.
(3) The technician creates the issue in the system, entering all relevant data, as provided by the customer.
(4) As work is done on that issue, the system is updated with new data by the technician. Any attempt at fixing the problem should be noted in the issue system. Ticket status most likely will be changed from open to pending.
(5) After the issue has been fully addressed, it is marked as resolved in the issue tracking system.
If the problem is not fully resolved, the ticket will be reopened once the technician receives new information from the customer. A Run Book Automation process that implements best practices for these workflows and increases IT personnel effectiveness is becoming very common." [Issue tracking system. Wikipedia]
The UML sequence diagram example "Ticket processing system" was created using the ConceptDraw PRO diagramming and vector drawing software extended with the Rapid UML solution from the Software Development area of ConceptDraw Solution Park.
UML sequence diagram
 USA Maps
Use the USA Maps solution to create a map of USA, a US interstate map, printable US maps, US maps with cities and US maps with capitals. Create a complete USA states map.
 Seating Plans
The Seating Plans solution including samples, seating chart templates and libraries of vector design elements assists in creating the Seating plans, Seating arrangement charts, Chair layout designs, Plan drawings of cinema seating, Movie theater chair plans, extensive Cinema theater plans depicting the seating arrangement in the cinema halls, location of closet, cafe and food sale area, in designing the Seating plans for the large seating areas, Seat plan designs for airplanes, trains, etc. Use any of the included samples as the table seating chart template or seating chart template free and achieve professional drawing results in a few minutes.
HelpDesk
How to Create SWOT Analysis Template

 Computer and Networks Area
The solutions from Computer and Networks Area of ConceptDraw Solution Park collect samples, templates and vector stencils libraries for drawing computer and network diagrams, schemes and technical drawings.
The vector stencils library "Project management" contains 30 project management icons.
Use it to design your business and finance illustrations and infographics with ConceptDraw PRO diagramming and vector drawing software.
The vector stencils library "Project management" is included in the Business and Finance solution from the Illustration area of ConceptDraw Solution Park.
Use it to design your business and finance illustrations and infographics with ConceptDraw PRO diagramming and vector drawing software.
The vector stencils library "Project management" is included in the Business and Finance solution from the Illustration area of ConceptDraw Solution Park.
Start project

Project plan

Project scheme

To do list

Checklist

Project strategy

Timetable

Project time

Project fulfillment

Project Gantt chart

Project completed

Project report

Project management

Project descriptions

Communications

Project team

Project director

Project manager

Assignment of works

Project analyst

Project benefits

Failure to draw on the funds

Cost overrun

Cost

Project expenses

Portfolio

Ticket

Project task

Financial resources

Material resources

 SWOT and TOWS Matrix Diagrams
SWOT and TOWS Matrix Diagrams solution extends ConceptDraw DIAGRAM and ConceptDraw MINDMAP software with features, templates, samples and libraries of vector stencils for drawing SWOT and TOWS analysis matrices and mind maps.
 Target and Circular Diagrams
This solution extends ConceptDraw DIAGRAM software with samples, templates and library of design elements for drawing the Target and Circular Diagrams.
 Aerospace and Transport
This solution extends ConceptDraw DIAGRAM software with templates, samples and library of vector clipart for drawing the Aerospace and Transport Illustrations. It contains clipart of aerospace objects and transportation vehicles, office buildings and anci
 Vehicular Networking
The Vehicular Networking solution extends the ConceptDraw DIAGRAM software functionality with specialized tools, wide variety of pre-made vector objects, collection of samples and templates in order to help network engineers design vehicular network diagrams for effective network engineering activity, visualize vehicular networks, develop smart transportation systems, design various types of vehicle network management diagrams, regional network diagrams, vehicular communication system diagrams, vehicular ad-hoc networks, vehicular delay-tolerant networks, and other network engineering schemes.
 Business Process Workflow Diagrams
The Business Process Workflow Diagrams solution enhances the ConceptDraw DIAGRAM functionality with predesigned examples, samples and a numerous collection of predesigned vector objects of workflow chart elements, icons, arrows, connectors, and varied wor
- Design elements - Travel and tourism pictograms | Process ...
- Airplane Ticket Drawing
- Travel and tourism pictograms - Vector stencils library | Travel and ...
- Travel and tourism pictograms - Vector stencils library | Design ...
- Travel and tourism pictograms - Vector stencils library | IVR services ...
- Travel and tourism pictograms - Vector stencils library | Travel and ...
- Travel and tourism pictograms - Vector stencils library | Travel and ...
- Time - Vector stencils library | Travel and tourism pictograms - Vector ...
- Travel Infographics | Design elements - Travel and tourism ...
- Design elements - Travel and tourism pictograms | Travel and ...
- Design elements - Travel and tourism pictograms | Process ...
- UML sequence diagram - Ticket processing system | Trouble ticket ...
- Travel and tourism pictograms - Vector stencils library | Education ...
- Timelines and milestones - Vector stencils library | Travel and ...
- Design elements - Travel and tourism pictograms | Travel and ...
- Travel and tourism pictograms - Vector stencils library | Travel and ...
- Basketball Field in the Vector | 2 Circle Venn Diagram. Venn ...
- Design elements - Travel and tourism pictograms | Design elements ...
- Travel and tourism pictograms - Vector stencils library | Design ...
- Travel and tourism pictograms - Vector stencils library | Qualifying ...