Bar Diagrams for Problem Solving. Create space science bar charts with Bar Graphs Solution

Create bar graphs for visual solving your scientific problems and data comparison using the ConceptDraw PRO diagramming and vector drawing software extended with the Bar Graphs Solution from the Graphs and Charts area of ConceptDraw Solition Park.
 Chemical and Process Engineering
This chemical engineering solution extends ConceptDraw PRO v.9.5 (or later) with process flow diagram symbols, samples, process diagrams templates and libraries of design elements for creating process and instrumentation diagrams, block flow diagrams (BFD
 Biology
Biology solution extends ConceptDraw PRO software with samples, templates and libraries containing biological vector symbols, to help you create scientific and educational designs in the field of biology.
Chemistry Drawings

that can be then successfully used in the field of science and education, on various conferences, and so on.
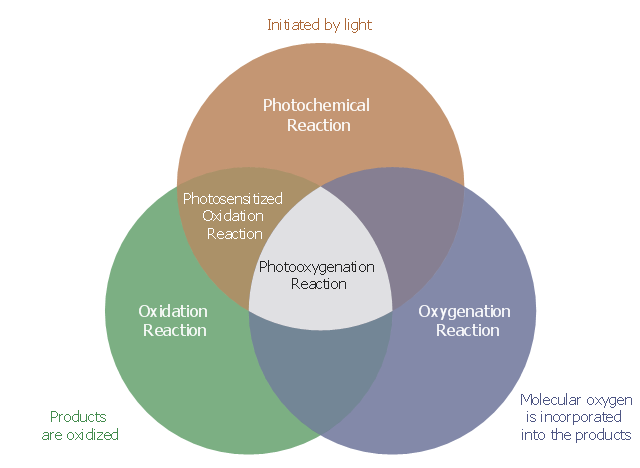
A Venn diagram differentiating between photochemical/ oxidation terminology.
This Venn diagram example was redesigned from the Wikimedia Commons file: Photooxygenation venn diagram.svg.
This file is licensed under the Creative Commons Attribution 3.0 Unported license.
[creativecommons.org/ licenses/ by/ 3.0/ deed.en]
"A photooxygenation is a light-induced oxidation reaction in which molecular oxygen is incorporated into the product(s). ... Early studies of photooxygenation focused on oxidative damage to DNA and amino acids, but recent research has led to the application of photooxygenation in organic synthesis and photodynamic therapy.
Photooxygenation reactions are initiated by a photosensitizer, which is a molecule that enters an excited state when exposed to light of a specific wavelength (e.g. dyes and pigments). The excited sensitizer then reacts with either a substrate or ground state molecular oxygen, starting a cascade of energy transfers that ultimately result in an oxygenated molecule. Consequently, photooxygenation reactions are categorized by the type and order of these intermediates (as type I, type II, or type III reactions). ...
Photooxygenation reactions are easily confused with a number of processes baring similar names (i.e. photosensitized oxidation). Clear distinctions can be made based on three attributes: oxidation, the involvement of light, and the incorporation of molecular oxygen into the products" [Photooxygenation. Wikipedia]
The Venn diagram example "Photooxygenation" was created using the ConceptDraw PRO diagramming and vector drawing software extended with the Venn Diagrams solution from the area "What is a Diagram" of ConceptDraw Solution Park.
Venn diagram
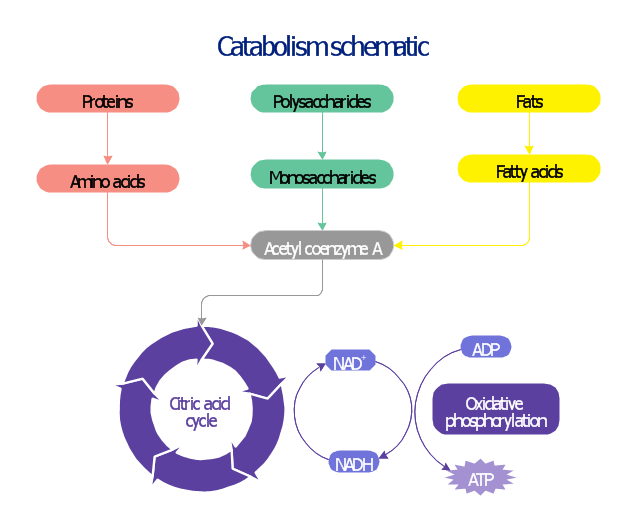
This biochemical chart display how proteins, polysaccharides and fats from food are digested into gastrointestinal tract into aminoacids, monosaccharides and fatty acids, and then broken down and oxidized to carbon dioxide and water in cellular processes of energy generation.
This metabolic pathway map was redesigned from Wikipedia file: Catabolism schematic.svg. [en.wikipedia.org/ wiki/ File:Catabolism_ schematic.svg]
The biochemical diagram example "Catabolism schematic" was created using the ConceptDraw PRO diagramming and vector drawing software extended with the Biology solution from the Science and Education area of ConceptDraw Solution Park.
Catabolic pathway map
The vector stencils library "Citric acid cycle (TCA cycle)" contains 26 symbols of metabolites for drawing metabolic pathway maps and biochemical shematic diagrams of the citric acid cycle (TCA cycle, tricarboxylic acid cycle, Krebs cycle) and diagrams of metabolism processes.
"The citric acid cycle - also known as the tricarboxylic acid cycle (TCA cycle), or the Krebs cycle, - is a series of chemical reactions used by all aerobic organisms to generate energy through the oxidation of acetate derived from carbohydrates, fats and proteins into carbon dioxide and chemical energy in the form of adenosine triphosphate (ATP). In addition, the cycle provides precursors of certain amino acids as well as the reducing agent NADH that is used in numerous other biochemical reactions. Its central importance to many biochemical pathways suggests that it was one of the earliest established components of cellular metabolism and may have originated abiogenically.
The name of this metabolic pathway is derived from citric acid (a type of tricarboxylic acid) that is consumed and then regenerated by this sequence of reactions to complete the cycle. In addition, the cycle consumes acetate (in the form of acetyl-CoA) and water, reduces NAD+ to NADH, and produces carbon dioxide as a waste byproduct. The NADH generated by the TCA cycle is fed into the oxidative phosphorylation (electron transport) pathway. The net result of these two closely linked pathways is the oxidation of nutrients to produce usable chemical energy in the form of ATP." [Citric acid cycle. Wikipedia]
The shapes example "Design elements - TCA cycle" is included in the Biology solution from the Science and Education area of ConceptDraw Solution Park.
Tricarboxylic acid cycle (Krebs cycle) symbols
-symbols--design-elements---tca-cycle.png--diagram-flowchart-example.png)
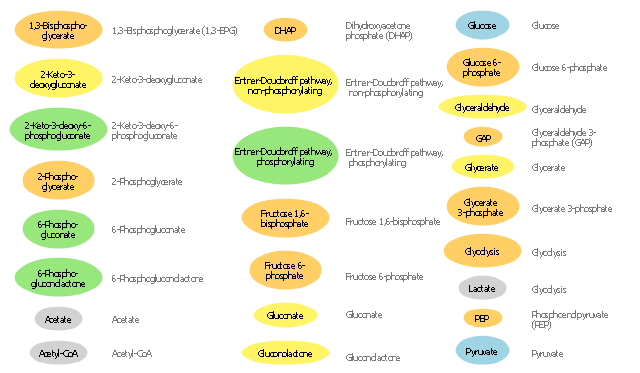
The vector stencils library "Carbohydrate metabolism" contains 25 icons of metabolite symbols.
Use these shapes for drawing carbohydrate metabolism schematics, biochemical diagrams and metabolic pathways maps.
"Carbohydrates are a superior short-term fuel for organisms because they are simpler to metabolize than fats or those amino acids (components of proteins) that can be used for fuel. In animals, the most important carbohydrate is glucose. The concentration of glucose in the blood is used as the main control for the central metabolic hormone, insulin. Starch, and cellulose in a few organisms (e.g., some animals ... and ... microorganisms), both being glucose polymers, are disassembled during digestion and absorbed as glucose. Some simple carbohydrates have their own enzymatic oxidation pathways, as do only a few of the more complex carbohydrates. The disaccharide lactose, for instance, requires the enzyme lactase to be broken into its monosaccharides components; many animals lack this enzyme in adulthood." [Carbohydrate metabolism. Wikipedia]
The shapes example "Design elements - Carbohydrate metabolism" is included in the Biology solution from the Science and Education area of ConceptDraw Solution Park.
Carbohydrate metabolite symbols
"Citric acid cycle (tricarboxylic acid cycle, TCA cycle, Krebs cycle) is a series of chemical reactions used by all aerobic organisms to generate energy through the oxidation of acetate derived from carbohydrates, fats and proteins into carbon dioxide and chemical energy in the form of adenosine triphosphate (ATP)." [Citric acid cycle. Wikipedia]
This biochemical diagram example shows metabolic pathways map of citric acid cycle reactions.
This sample was redesigned from the Wikimedia Commons file: TCA cycle.svg. [commons.wikimedia.org/ wiki/ File:TCA_ cycle.svg]
This image is licensed under the Creative Commons Attribution 3.0 Unported license. [creativecommons.org/ licenses/ by/ 3.0/ deed.en]
The metabolic pathway map example "Citric acid cycle (TCA cycle)" was created using the ConceptDraw PRO diagramming and vector drawing software extended with the Biology solution from the Science and Education area of ConceptDraw Solution Park.
Tricarboxylic acid cycle
.png--diagram-flowchart-example.png)
- Process flow diagram (PFD) template | Jet fuel mercaptan oxidation ...
- Jet fuel mercaptan oxidation treating - PFD | Process Diagrams ...
- Jet fuel mercaptan oxidation treating - PFD | Amine treating unit ...
- Process Flow Diagram | Amine treating unit schematic diagram | Jet ...
- Jet fuel mercaptan oxidation treating - PFD | Process flow diagram ...
- Crude oil distillation unit - PFD | Process flow diagram (PFD ...
- Process Flow Diagram | Jet fuel mercaptan oxidation treating - PFD ...
- Jet fuel mercaptan oxidation treating - PFD | Chemical and Process ...
- Amine treating unit schematic diagram | Jet fuel mercaptan oxidation ...
- UML Deployment Diagram . Design Elements | Jet fuel mercaptan ...
- How to Draw a Chemical Process Flow Diagram | Chemical and ...
- Chemistry Drawings | Bar Diagrams for Problem Solving. Create ...
- Jet fuel mercaptan oxidation treating - PFD | Natural gas condensate ...
- Centrifuge Process Flow Diagram
- Process flow diagram - Jet fuel mercaptan oxidation treating | Flow ...
- Process Flowchart | Process flow diagram (PFD) template ...
- How to Draw a Chemical Process Flow Diagram | Chemical and ...
- Process Flowchart | Chemical and Process Engineering | Chemical ...
- Process Flowchart | Chemical and Process Engineering | Process ...
- Process flow diagram - Typical oil refinery | Jet fuel mercaptan ...