 25 Typical Orgcharts
The 25 Typical Orgcharts solution contains powerful organizational structure and organizational management drawing tools, a variety of professionally designed organization chart and matrix organization structure samples, 25 templates based on various orga
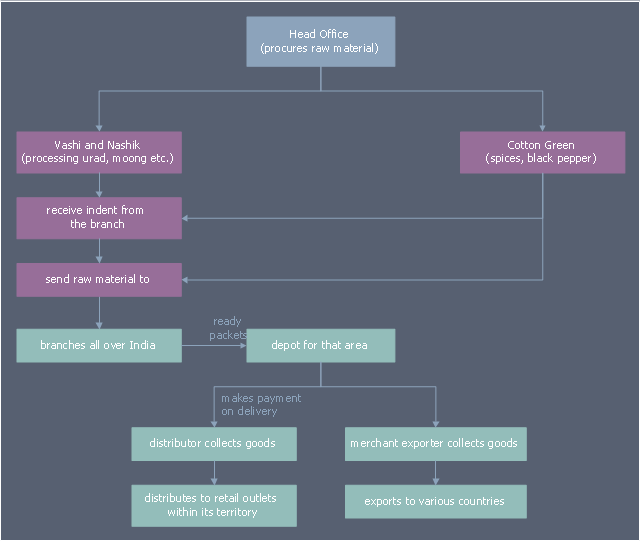
This business process flowchart example was redesigned from the Wikimedia Commons file: SMGULP-distribution-flowchart.png.
[commons.wikimedia.org/ wiki/ File:SMGULP-distribution-flowchart.png]
"Shri Mahila Griha Udyog Lijjat Papad, popularly known as Lijjat, is an Indian women's cooperative involved in manufacturing of various fast moving consumer goods." [Shri Mahila Griha Udyog Lijjat Papad. Wikipedia]
The business process map example "Distribution flowchart example" was drawn using the ConceptDraw PRO diagramming and business graphics software extended with the Business Process Mapping solution from the Business Processes area of ConceptDraw Solution Park.
Business process map
 Fishbone Diagrams
The Fishbone Diagrams solution extends ConceptDraw PRO v10 software with the ability to easily draw the Fishbone Diagrams (Ishikawa Diagrams) to clearly see the cause and effect analysis and also problem solving. The vector graphic diagrams produced using this solution can be used in whitepapers, presentations, datasheets, posters, and published technical material.
Example of DFD for Online Store (Data Flow Diagram) DFD Example


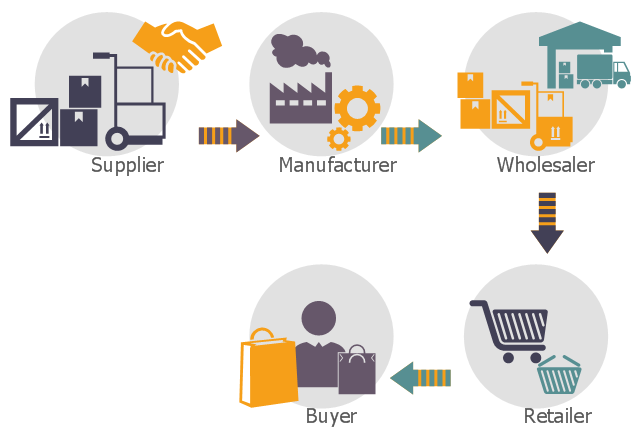
This logistic flow chart sample shows the groups in a supply chain cut out by disintermediation.
It was designed on the base of the Wikimedia Commons file: Disintermediation graphic.PNG. [commons.wikimedia.org/ wiki/ File:Disintermediation_ graphic.PNG]
This file is licensed under the Creative Commons Attribution-Share Alike 3.0 Unported license. [creativecommons.org/ licenses/ by-sa/ 3.0/ deed.en]
"In economics, disintermediation is the removal of intermediaries from a supply chain, or "cutting out the middlemen" in connection with a transaction or a series of transactions. Instead of going through traditional distribution channels, which had some type of intermediary (such as a distributor, wholesaler, broker, or agent), companies may now deal with customers directly, for example via the Internet." [Disintermediation. Wikipedia]
The logistic flowchart example "Groups in a supply chain cut out by disintermediation" was created using ConceptDraw PRO diagramming and vector drawing software extended with the Logistics Flow Charts solution from the Business Processes area of ConceptDraw Solution Park.
Logistic flowchart
 Business Process Mapping
The Business Process Mapping solution for ConceptDraw PRO is for users involved in process mapping and creating SIPOC diagrams.
Process Mapping

Hybrid Network Topology

How To use House Electrical Plan Software


- Distribution Process Flow Chart
- Sales Distribution Flow Chart
- Simple Products Marketing And Distribution Process Flow Chart
- Logistics Flow Charts | Flow chart Example. Warehouse Flowchart ...
- Logistics Flow Charts | Frequency Distribution Dashboard | How to ...
- Organization chart - Foodbank | Flow chart Example. Warehouse ...
- Flow chart Example. Warehouse Flowchart | Fmcg Distribution ...
- Organizational Chart Of A Food Distribution Company
- Flowchart Distributor Logistics Process