This site uses cookies. By continuing to browse the ConceptDraw site you are agreeing to our Use of Site Cookies.
HelpDesk

How to Draw a Block Diagram

Block diagram is a simple chart that use blocks to show some elements or activities, and connectors that show the relationship between neighboring blocks. They are commonly simple, giving an overview of a process without necessarily going into the specifics of implementation. Block diagrams are commonly used to depict a general description of a system and its activity. A most known sample of a block diagram is a flow chart, used in many types of business as a common method of representing repeated processes. Easy and a simple creation, a number of objects and connectors make the block diagram a many-sided tool for various industries. The ability to make block diagrams is delivered by the ConceptDraw Block Diagrams solution.
HelpDesk

How To Convert a Block Diagram to Adobe PDF

ConceptDraw DIAGRAM allows you to easily share your business documentation between different computers with different operating systems and applications using its export capabilities. You can get a clear business graphic pack in pdf format and avoid any problems while communicating them with stakeholders.

IDEF3 Standard

Use Case Diagrams technology. IDEF3 Standard is intended for description and further analysis of technological processes of an enterprise. Using IDEF3 standard it is possible to examine and model scenarios of technological processes.
HelpDesk

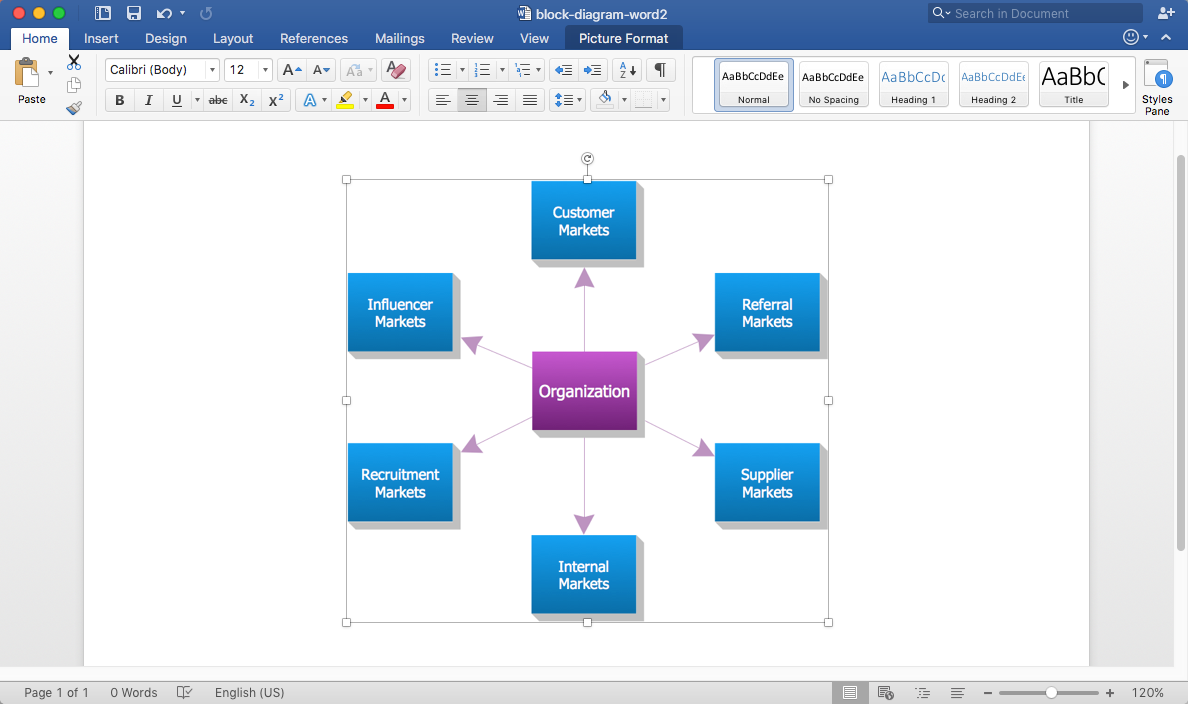
How to Add a Block Diagram to an MS Word ™ Document

Block diagram consists of graphic blocks. Blocks are connected by lines or arrows. Block diagrams are used to show the relationship between parts of some systems. It can be used for the development of new systems or to improve existing ones. The structure of the block diagram gives a high-level overview of the major components of the system, as well as the important relationships. Using the block diagrams, you can more effectively present the business data contained in your MS Word documents. ConceptDraw DIAGRAM allows you to easily create block diagrams and then insert them into an MS Word document.

Bubble diagrams in Landscape Design with ConceptDraw DIAGRAM

To define the links between the different areas of your own landscape design and see the project from aside, we recommend to draw landscape diagram called bubble one which is analogue of «mind maps» as it allows us to create approximate image of our future proper landscape view. Use special libraries (and we have plenty of them) with objects of landscape design to be able to create the detailed plan of your landscape which will be looking so smart and professionally good as the samples we provide were created by designers who know so much about making such kinds of design plans. Having ConceptDraw DIAGRAM as the assistant in your work, will ensure the success after using our product. Make the bubble diagrams as well as any other ones in minutes with ease having our application called ConceptDraw DIAGRAM and you will see how quick it will change your life simplifying lots of work.
HelpDesk

How to Draw a Pyramid Diagram

Pyramid diagram (triangle diagram) is used to represent data, which have hierarchy and basics. Due to the triangular form of a diagram, each pyramid section has a different width. The width of the segment shows the level of its hierarchy. Typically, the top of the pyramid is the data that are more important than the base data. A pyramid scheme can be used to show proportional and hierarchical relationships between some logically related items, such as departments within an organization, or successive elements of any process. This type of diagram is often used in marketing to display hierarchically related data, but it can be used in a variety of situations. ConceptDraw DIAGRAM allows you to make a pyramid diagram, quickly and easily using special libraries.