This cloud computing infographic example was drawn on the base of Wikimedia Commons file: Cloud computing types.svg. [commons.wikimedia.org/ wiki/ File:Cloud_ computing_ types.svg]
This file is licensed under the Creative Commons Attribution-Share Alike 3.0 Unported license. [creativecommons.org/ licenses/ by-sa/ 3.0/ deed.en]
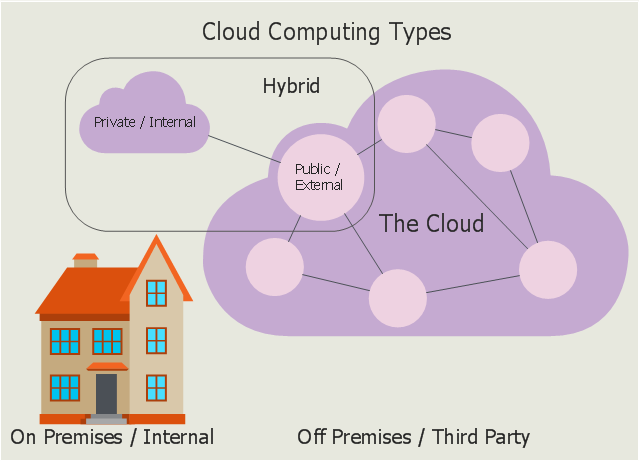
"Deployment models
Private cloud
Private cloud is cloud infrastructure operated solely for a single organization, whether managed internally or by a third-party, and hosted either internally or externally. ...
Public cloud
A cloud is called a "public cloud" when the services are rendered over a network that is open for public use. Public cloud services may be free. Technically there may be little or no difference between public and private cloud architecture, however, security consideration may be substantially different for services (applications, storage, and other resources) that are made available by a service provider for a public audience and when communication is effected over a non-trusted network. Generally, public cloud service providers like Amazon AWS, Microsoft and Google own and operate the infrastructure at their data center and access is generally via the Internet." [Cloud computing. Wikipedia]
The infographic example "Cloud computing types" was drawn using ConceptDraw PRO software extended with the Cloud Computing Diagrams solution from the Computer and Networks area of ConceptDraw Solution Park.
This file is licensed under the Creative Commons Attribution-Share Alike 3.0 Unported license. [creativecommons.org/ licenses/ by-sa/ 3.0/ deed.en]
"Deployment models
Private cloud
Private cloud is cloud infrastructure operated solely for a single organization, whether managed internally or by a third-party, and hosted either internally or externally. ...
Public cloud
A cloud is called a "public cloud" when the services are rendered over a network that is open for public use. Public cloud services may be free. Technically there may be little or no difference between public and private cloud architecture, however, security consideration may be substantially different for services (applications, storage, and other resources) that are made available by a service provider for a public audience and when communication is effected over a non-trusted network. Generally, public cloud service providers like Amazon AWS, Microsoft and Google own and operate the infrastructure at their data center and access is generally via the Internet." [Cloud computing. Wikipedia]
The infographic example "Cloud computing types" was drawn using ConceptDraw PRO software extended with the Cloud Computing Diagrams solution from the Computer and Networks area of ConceptDraw Solution Park.
Infographic
Internet solutions with ConceptDraw DIAGRAM

Total Quality Management Value

Network Topologies


 Total Quality Management TQM Diagrams
Total Quality Management Diagrams solution extends ConceptDraw DIAGRAM software with samples, templates and vector stencils library for drawing the TQM flowcharts.
 Area Charts
Area Charts are used to display the cumulative totals over time using numbers or percentages; or to show trends over time among related attributes. The Area Chart is effective when comparing two or more quantities. Each series of data is typically represented with a different color, the use of color transparency in an object’s transparency shows overlapped areas and smaller areas hidden behind larger areas.
 Scatter Diagrams
The Scatter Diagrams solution extends ConceptDraw DIAGRAM functionality with templates, samples, and a library of vector stencils that make construction of a Scatter Plot easy. The Scatter Chart Solution makes it easy to design attractive Scatter Diagrams used in various fields of science, work, and life activities. ConceptDraw DIAGRAM lets you enter the data to the table and construct the Scatter Plot Graph automatically according to these data.
- Cloud Computing Diagrams | Cloud Computing | How to Create a ...
- Difference Between Erd And Dfd
- Cloud Computing | AWS Architecture Diagrams | How to Convert a ...
- Difference Between Data Flow Diagram And Entity Relationship
- Organizational Charts | Basic Flowchart Symbols and Meaning ...
- Data Flow Diagram Model | Process Flowchart | How to Build Cloud ...
- Architectural Context Diagram Example
- Basic Flowchart Symbols and Meaning | Simple Flow Chart ...
- Difference Between Architecture Context Diagram And Architecture
- Mechanical Engineering | Mechanical Drawing Symbols | Butt weld ...
- ConceptDraw PRO ER Diagram Tool | Entity Relationship Diagram ...
- 4 Level pyramid model diagram - Information systems types | 5 Level ...
- Drawing Flow Charts With Smart Lines Between Boxes
- Conceptdraw.com: Mind Map Software, Drawing Tools | Project ...
- Entity Relationship Context Diagram
- Data Flow Diagrams (DFD) | Draw Network Diagram based on ...
- Basic Flowchart Symbols and Meaning | Process Flowchart | Sales ...
- Types of Flowcharts | Process Flowchart | Database Flowchart ...
- Design elements - Rotating equipment | Design elements - Lamps ...
- Organizational Charts | Basic Flowchart Symbols and Meaning ...