 Logistics Flow Charts
Logistics Flow Charts solution extends ConceptDraw PRO v11 functionality with opportunities of powerful logistics management software. It provides large collection of predesigned vector logistic symbols, pictograms, objects and clipart to help you design with pleasure Logistics flow chart, Logistics process flow diagram, Inventory flow chart, Warehouse flowchart, Warehouse management flow chart, Inventory control flowchart, or any other Logistics diagram. Use this solution for logistics planning, to reflect logistics activities and processes of an enterprise or firm, to depict the company's supply chains, to demonstrate the ways of enhancing the economic stability on the market, to realize logistics reforms and effective products' promotion.
UML Class Diagram Example for Transport System

HelpDesk
How To Design Warning Infographics Using Transport Hazard Pictograms

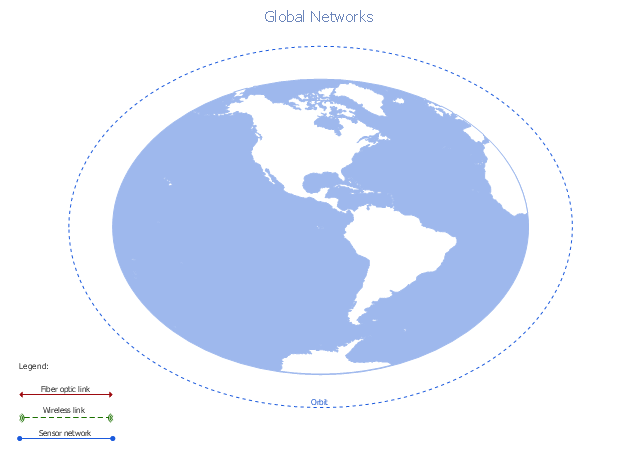
A conceptual diagram of a global vehicular network describes the principles of communication between vehicles, earth-based nodes, and space-based nodes in a wireless network. It illustrates the concept of architecture within global vehicular networks.
"Intelligent transportation systems (ITS) are advanced applications which, without embodying intelligence as such, aim to provide innovative services relating to different modes of transport and traffic management and enable various users to be better informed and make safer, more coordinated, and 'smarter' use of transport networks.
...
Intelligent transport systems vary in technologies applied, from basic management systems such as car navigation; traffic signal control systems; container management systems; variable message signs; automatic number plate recognition or speed cameras to monitor applications, such as security CCTV systems; and to more advanced applications that integrate live data and feedback from a number of other sources, such as parking guidance and information systems; weather information; bridge deicing systems; and the like." [Intelligent transportation system. Wikipedia]
The global vehicular network diagram template is included in the Vehicular Networking solution from the Computer and Networks area of ConceptDraw Solution Park.
Global vehicular network diagram template
 Interactive Voice Response Diagrams
Interactive Voice Response Diagrams solution extends ConceptDraw PRO v10 software with samples, templates and libraries of ready-to-use vector stencils that help create Interactive Voice Response (IVR) diagrams illustrating in details a work of interactive voice response system, the IVR system’s logical and physical structure, Voice-over-Internet Protocol (VoIP) diagrams, and Action VoIP diagrams with representing voice actions on them, to visualize how the computers interact with callers through voice recognition and dual-tone multi-frequency signaling (DTMF) keypad inputs.
Electrical Symbols, Electrical Diagram Symbols

 Telecommunication Network Diagrams
Telecommunication Network Diagrams solution extends ConceptDraw PRO software with samples, templates, and great collection of vector stencils to help the specialists in a field of networks and telecommunications, as well as other users to create Computer systems networking and Telecommunication network diagrams for various fields, to organize the work of call centers, to design the GPRS networks and GPS navigational systems, mobile, satellite and hybrid communication networks, to construct the mobile TV networks and wireless broadband networks.
How to Build Cloud Computing Diagram Principal Cloud Manufacturing

Winter Sports Vector Clipart. Medal Map. Spatial Infographics

How to draw Metro Map style infographics? (London)

- Simple Diagram Of Means Of Transportation
- Draw A Diagram Of Various Means Of Transportation
- Logistics Flow Charts | Intermodal transport chain | Mode Of ...
- Modes Of Transportation Diagram And Images
- How To Draw Flow Diagram Showing Means Of Transportation
- Diagrams That Illustrate The Means Of Transportation
- Modes Of Transportation Diagram
- With The Aid Of Diagram Explain The Different Mode Of Transportation
- Network Diagram Software (PRO) | Means Of Transport And ...
- Means Of Transportation With Diagrams