Structured Systems Analysis and Design Method (SSADM) with ConceptDraw DIAGRAM

 Entity-Relationship Diagram (ERD)
Entity-Relationship Diagram (ERD) solution extends ConceptDraw DIAGRAM software with templates, samples and libraries of vector stencils from drawing the ER-diagrams by Chen's and crow’s foot notations.
This vector stencils library contains 47 SysML symbols.
Use it to design your state machine diagrams using ConceptDraw PRO diagramming and vector drawing software.
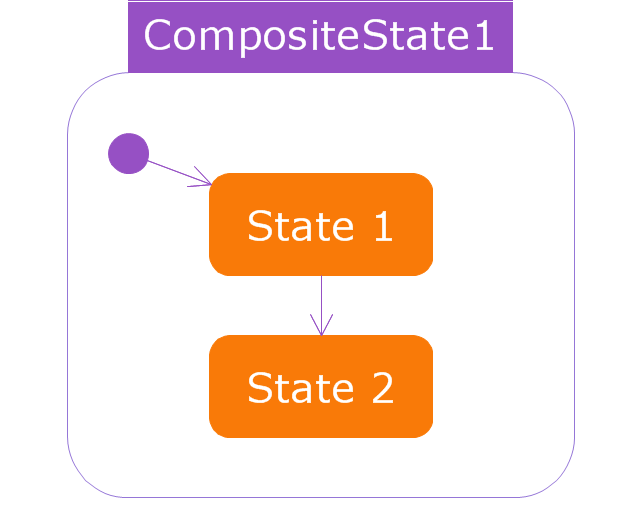
"The state diagram in the Unified Modeling Language is essentially a Harel statechart with standardized notation, which can describe many systems, from computer programs to business processes. In UML 2 the name has been changed to State Machine Diagram. The following are the basic notational elements that can be used to make up a diagram:
- Filled circle, representing to the initial state
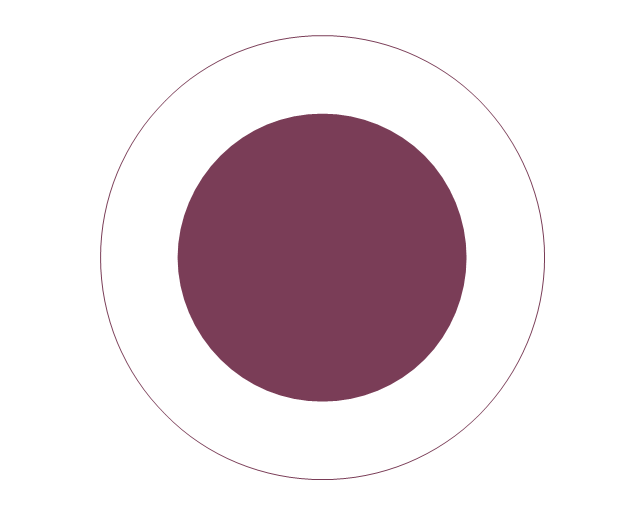
- Hollow circle containing a smaller filled circle, indicating the final state (if any)
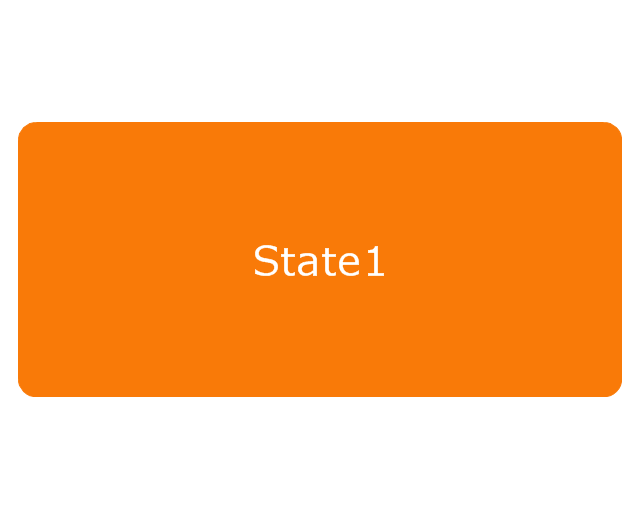
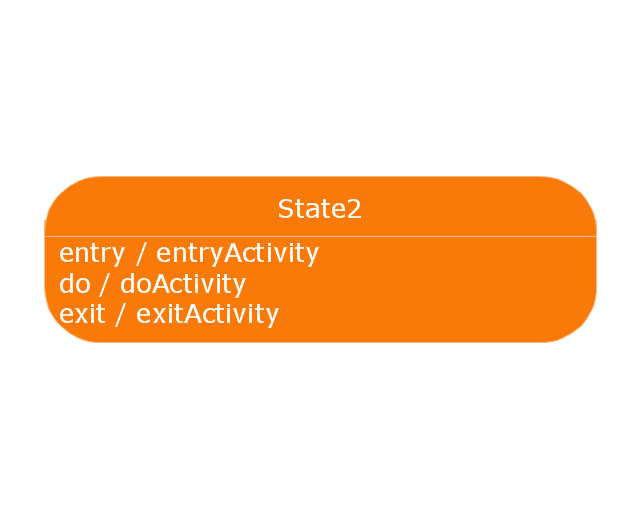
- Rounded rectangle, denoting a state. Top of the rectangle contains a name of the state. Can contain a horizontal line in the middle, below which the activities that are done in that state are indicated
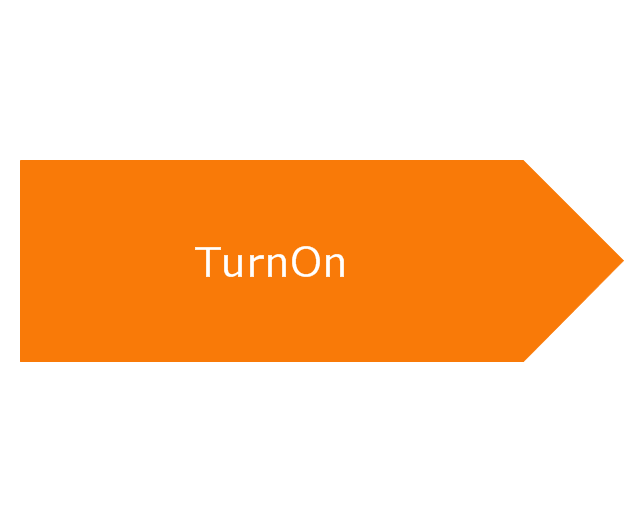
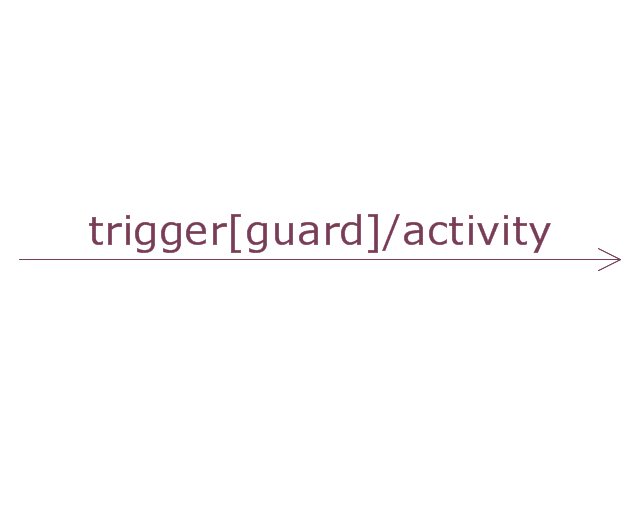
- Arrow, denoting transition. The name of the event (if any) causing this transition labels the arrow body. A guard expression may be added before a "/ " and enclosed in square-brackets ( eventName[guardExpression] ), denoting that this expression must be true for the transition to take place. If an action is performed during this transition, it is added to the label following a "/ " ( eventName[guardExpression]/ action ).
- Thick horizontal line with either x>1 lines entering and 1 line leaving or 1 line entering and x>1 lines leaving. These denote join/ fork, respectively." [State diagram (UML). Wikipedia]
The vector stencils library "State machine diagram" is included in the SysML solution from the Software Development area of ConceptDraw Solution Park.
Use it to design your state machine diagrams using ConceptDraw PRO diagramming and vector drawing software.
"The state diagram in the Unified Modeling Language is essentially a Harel statechart with standardized notation, which can describe many systems, from computer programs to business processes. In UML 2 the name has been changed to State Machine Diagram. The following are the basic notational elements that can be used to make up a diagram:
- Filled circle, representing to the initial state
- Hollow circle containing a smaller filled circle, indicating the final state (if any)
- Rounded rectangle, denoting a state. Top of the rectangle contains a name of the state. Can contain a horizontal line in the middle, below which the activities that are done in that state are indicated
- Arrow, denoting transition. The name of the event (if any) causing this transition labels the arrow body. A guard expression may be added before a "/ " and enclosed in square-brackets ( eventName[guardExpression] ), denoting that this expression must be true for the transition to take place. If an action is performed during this transition, it is added to the label following a "/ " ( eventName[guardExpression]/ action ).
- Thick horizontal line with either x>1 lines entering and 1 line leaving or 1 line entering and x>1 lines leaving. These denote join/ fork, respectively." [State diagram (UML). Wikipedia]
The vector stencils library "State machine diagram" is included in the SysML solution from the Software Development area of ConceptDraw Solution Park.
Choice pseudostate

Composite state
Entry point
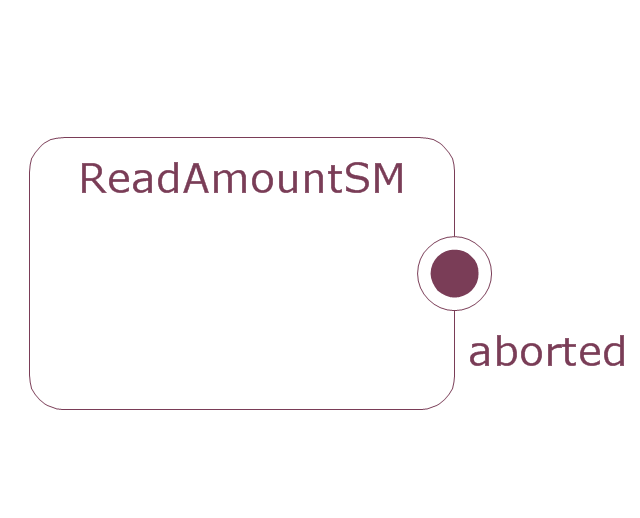
Exit point
Final state
History, deep pseudostate
History, shallow pseudostate
Initial pseudostate
Junction pseudostate

Receive signal action
Send signal action
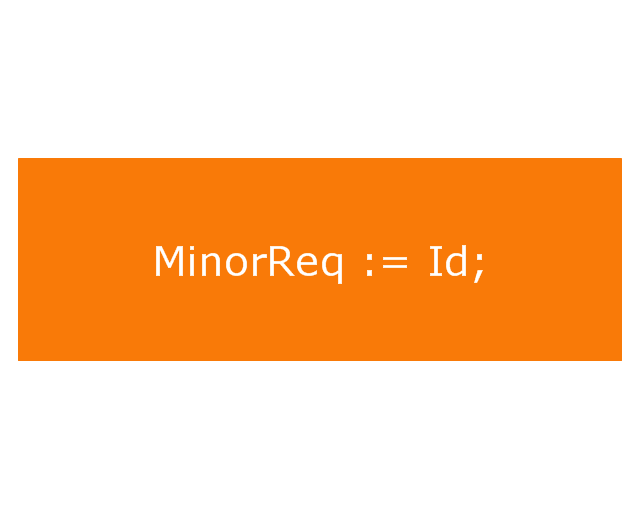
Action
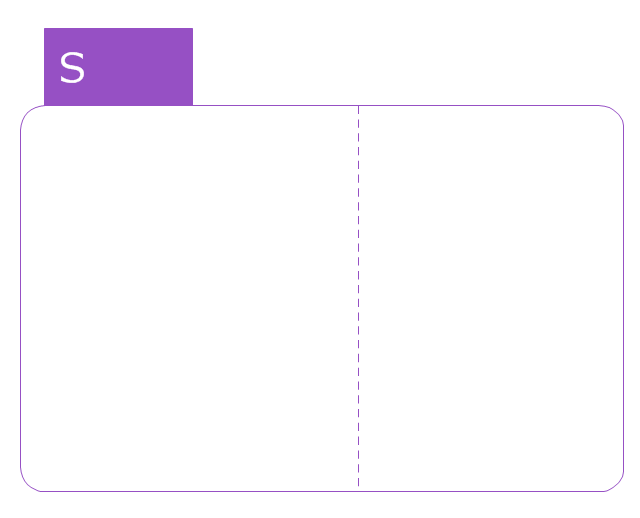
Region
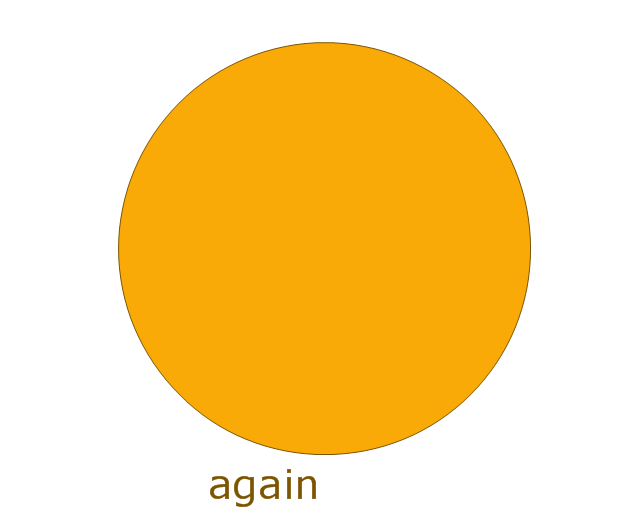
Simple state
Simple state 2
State list

State machine
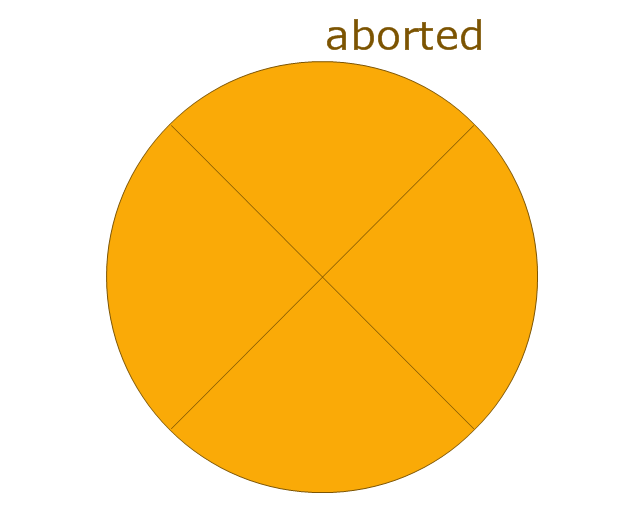
Terminate node

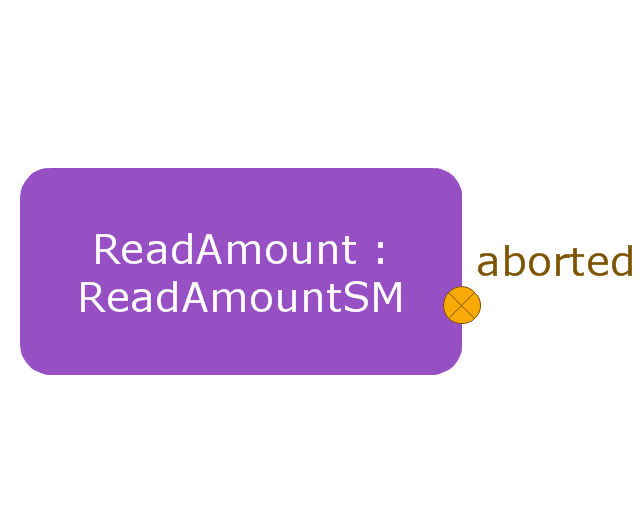
Submachine state
Transition
This example was redesigned from the Wikimedia Commons file: Example of High Level Fault Tree.jpg. [commons.wikimedia.org/ wiki/ File:Example_ of_ High_ Level_ Fault_ Tree.jpg]
"Risk assessment is the determination of quantitative or qualitative value of risk related to a concrete situation and a recognized threat (also called hazard). Quantitative risk assessment requires calculations of two components of risk (R):, the magnitude of the potential loss (L), and the probability (p) that the loss will occur. Acceptable risk is a risk that is understood and tolerated usually because the cost or difficulty of implementing an effective countermeasure for the associated vulnerability exceeds the expectation of loss.
In all types of engineering of complex systems sophisticated risk assessments are often made within Safety engineering and Reliability engineering when it concerns threats to life, environment or machine functioning. The nuclear, aerospace, oil, rail and military industries have a long history of dealing with risk assessment. Also, medical, hospital, social service and food industries control risks and perform risk assessments on a continual basis. Methods for assessment of risk may differ between industries and whether it pertains to general financial decisions or environmental, ecological, or public health risk assessment." [Risk assessment. Wikipedia]
The FTA diagram example "High level fault tree" was created using the ConceptDraw PRO diagramming and vector drawing software extended with the Fault Tree Analysis Diagrams solution from the Engineering area of ConceptDraw Solution Park.
FTA diagram

Use the vector clipart library Funny animals to draw your own cartoon illustrations for children's literature, boards and cards educational games for kids.
"Children's literature or juvenile literature includes stories, books, and poems that are enjoyed by children." [Children's literature. Wikipedia]
"Educational games are games explicitly designed with educational purposes, or which have incidental or secondary educational value. All types of games may be used in an educational environment. Educational games are games that are designed to teach people about certain subjects, expand concepts, reinforce development, understand an historical event or culture, or assist them in learning a skill as they play. Game types include board, card, and video games." [Educational game. Wikipedia]
The Fairy tales - Vector illustration example was created using ConceptDraw PRO diagramming and vector drawing software extended with the Artwork solution from the Illustration area of ConceptDraw Solution Park.
Cartoon
Use the vector clipart library Funny transport to draw your own cartoon illustrations with images of vehicles for children's literature, boards and cards educational games for kids using the ConceptDraw PRO diagramming and vector drawing software.
"Children's literature or juvenile literature includes stories, books, and poems that are enjoyed by children." [Children's literature. Wikipedia] "Educational games are games explicitly designed with educational purposes, or which have incidental or secondary educational value. All types of games may be used in an educational environment. Educational games are games that are designed to teach people about certain subjects, expand concepts, reinforce development, understand an historical event or culture, or assist them in learning a skill as they play. Game types include board, card, and video games." [Educational game. Wikipedia]
The Transport - Vector illustration example was created using the Artwork solution from the Illustration area of ConceptDraw Solution Park.
Cartoon
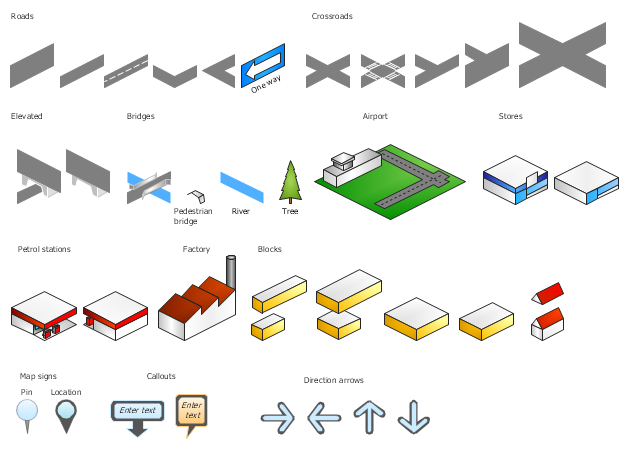
The vector stencils library "3D directional maps" contains 40 symbols for creating pictorial maps, street maps, locator maps, transit maps, tourist maps with points of interest (POI), road maps and route maps using the ConceptDraw PRO diagramming and vector drawing software.
"Pictorial maps are a category of maps that are also loosely called illustrated maps, panoramic maps, perspective maps, bird’s-eye view maps and Geopictorial maps amongst others. In contrast to the regular road map, Atlas or topographic cartography, pictorial maps depict a given territory with a more artistic rather than technical style. The cartography can be a sophisticated 3-D perspective landscape or a simple map graphic enlivened with illustrations of buildings, people and animals. They can feature all sorts of varied topics like historical events, legendary figures or local agricultural products and cover anything from an entire continent to a college campus. ...
Pictorial maps usually show an area as if viewed from above at an oblique angle. They are not generally drawn to scale in order to show street patterns, individual buildings, and major landscape features in perspective. While regular maps focus on the accurate rendition of distances, pictorial maps enhance landmarks and often incorporate a complex interplay of different scales into one image in order to give the viewer a more familiar sense of recognition." [Pictorial maps. Wikipedia]
The design elements library "3D directional maps" is included in the Directional Maps solution from the Maps area of ConceptDraw Solution Park.
3D pictorial map symbols
Mac Compatible Remote Presentation


Geo Map — USA — Alaska

 Area Charts
Area Charts are used to display the cumulative totals over time using numbers or percentages; or to show trends over time among related attributes. The Area Chart is effective when comparing two or more quantities. Each series of data is typically represented with a different color, the use of color transparency in an object’s transparency shows overlapped areas and smaller areas hidden behind larger areas.
Competitor Analysis

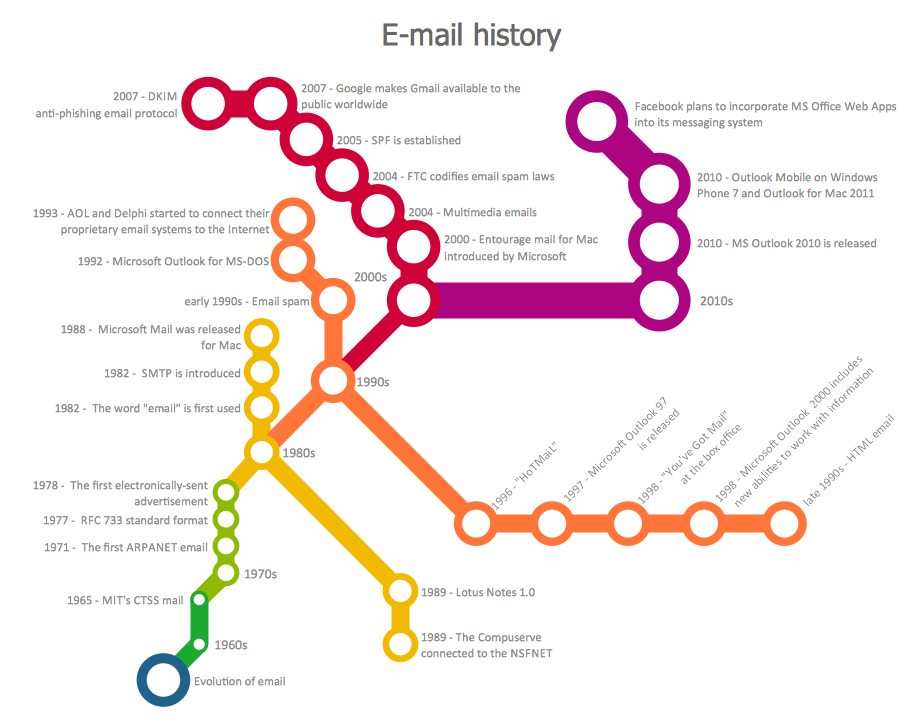
Metro Maps
- Funny transport - Vector illustration
- Fishbone Diagram | Business Productivity Diagramming | Using ...
- Purchase order processing UML activity diagram | Event -driven ...
- UML activity diagram - Deposit slip processing | Entity-Relationship ...
- 3D Network Diagram Software | Maps | Design elements - 3D ...
- Music - Vector illustration | Funny transport - Vector illustration | Fairy ...
- 3D Network Diagram Software | Basic Diagramming | How to Draw a ...
- Funny transport - Vector illustration | Design elements - Funny ...
- Fundraising Pyramid | 3D pictorial street map | Fundraising pyramid ...
- UML Activity Diagram
- Project timeline diagram | Design elements - Timelines and ...
- How to Make a Timeline | Timeline Diagrams | Project Timeline ...
- UML Class Diagram Example for Transport System | Aerospace and ...
- Accident analytic tree - FTA diagram | FTA diagram - Hazard ...
- UML State Machine Diagram .Design Elements | Vector stencils ...
- FTA diagram - Hazard analysis | Design elements - Fault tree ...
- Network Topology Illustration | Business and Finance Illustrations ...
- Funny animals - Vector stencils library | Design elements - Funny ...
- IDEF0 Visio | Basic Audit Flowchart. Flowchart Examples | Event ...
- UML State Machine Diagram .Design Elements | Vector stencils ...