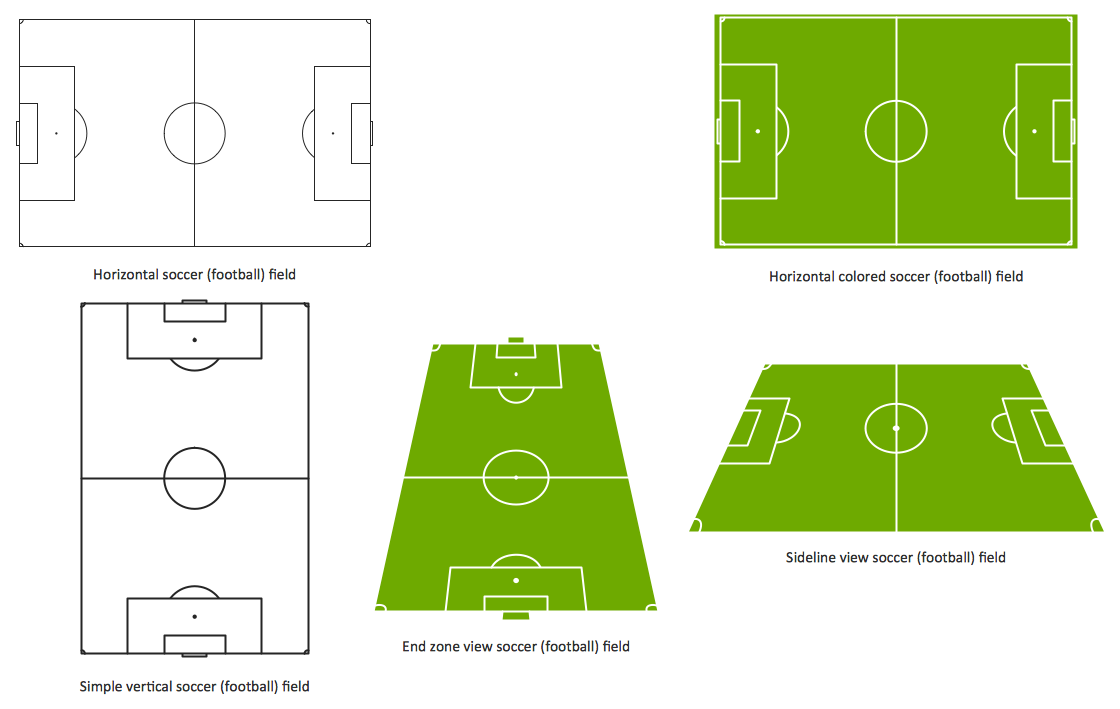
Design a Soccer (Football) Field
The Soccer (Football) Fields library from the Soccer solution from the Sport area of ConceptDraw Solution Park provides a complete set of predesigned fields: horizontal and vertical located, colored or not, end zone view soccer field.Basic Flowchart Symbols and Meaning
Flowcharts are the best for visually representation the business processes and the flow of a custom-order process through various departments within an organization. ConceptDraw DIAGRAM diagramming and vector drawing software extended with Flowcharts solution offers the full set of predesigned basic flowchart symbols which are gathered at two libraries: Flowchart and Flowcharts Rapid Draw. Among them are: process, terminator, decision, data, document, display, manual loop, and many other specific symbols. The meaning for each symbol offered by ConceptDraw gives the presentation about their proposed use in professional Flowcharts for business and technical processes, software algorithms, well-developed structures of web sites, Workflow diagrams, Process flow diagram and correlation in developing on-line instructional projects or business process system. Use of ready flow chart symbols in diagrams is incredibly useful - you need simply drag desired from the libraries to your document and arrange them in required order. There are a few serious alternatives to Visio for Mac, one of them is ConceptDraw DIAGRAM. It is one of the main contender with the most similar features and capabilities.
Baseball — Pitching and the Strike Zone
Visual depiction is key secret to successful understanding baseball strike zone dimentions. Baseball strike zone diagram illustrated using ConceptDraw DIAGRAM software enhanced with the Baseball solution from the ConceptDraw Solution Park.Blueprint Software
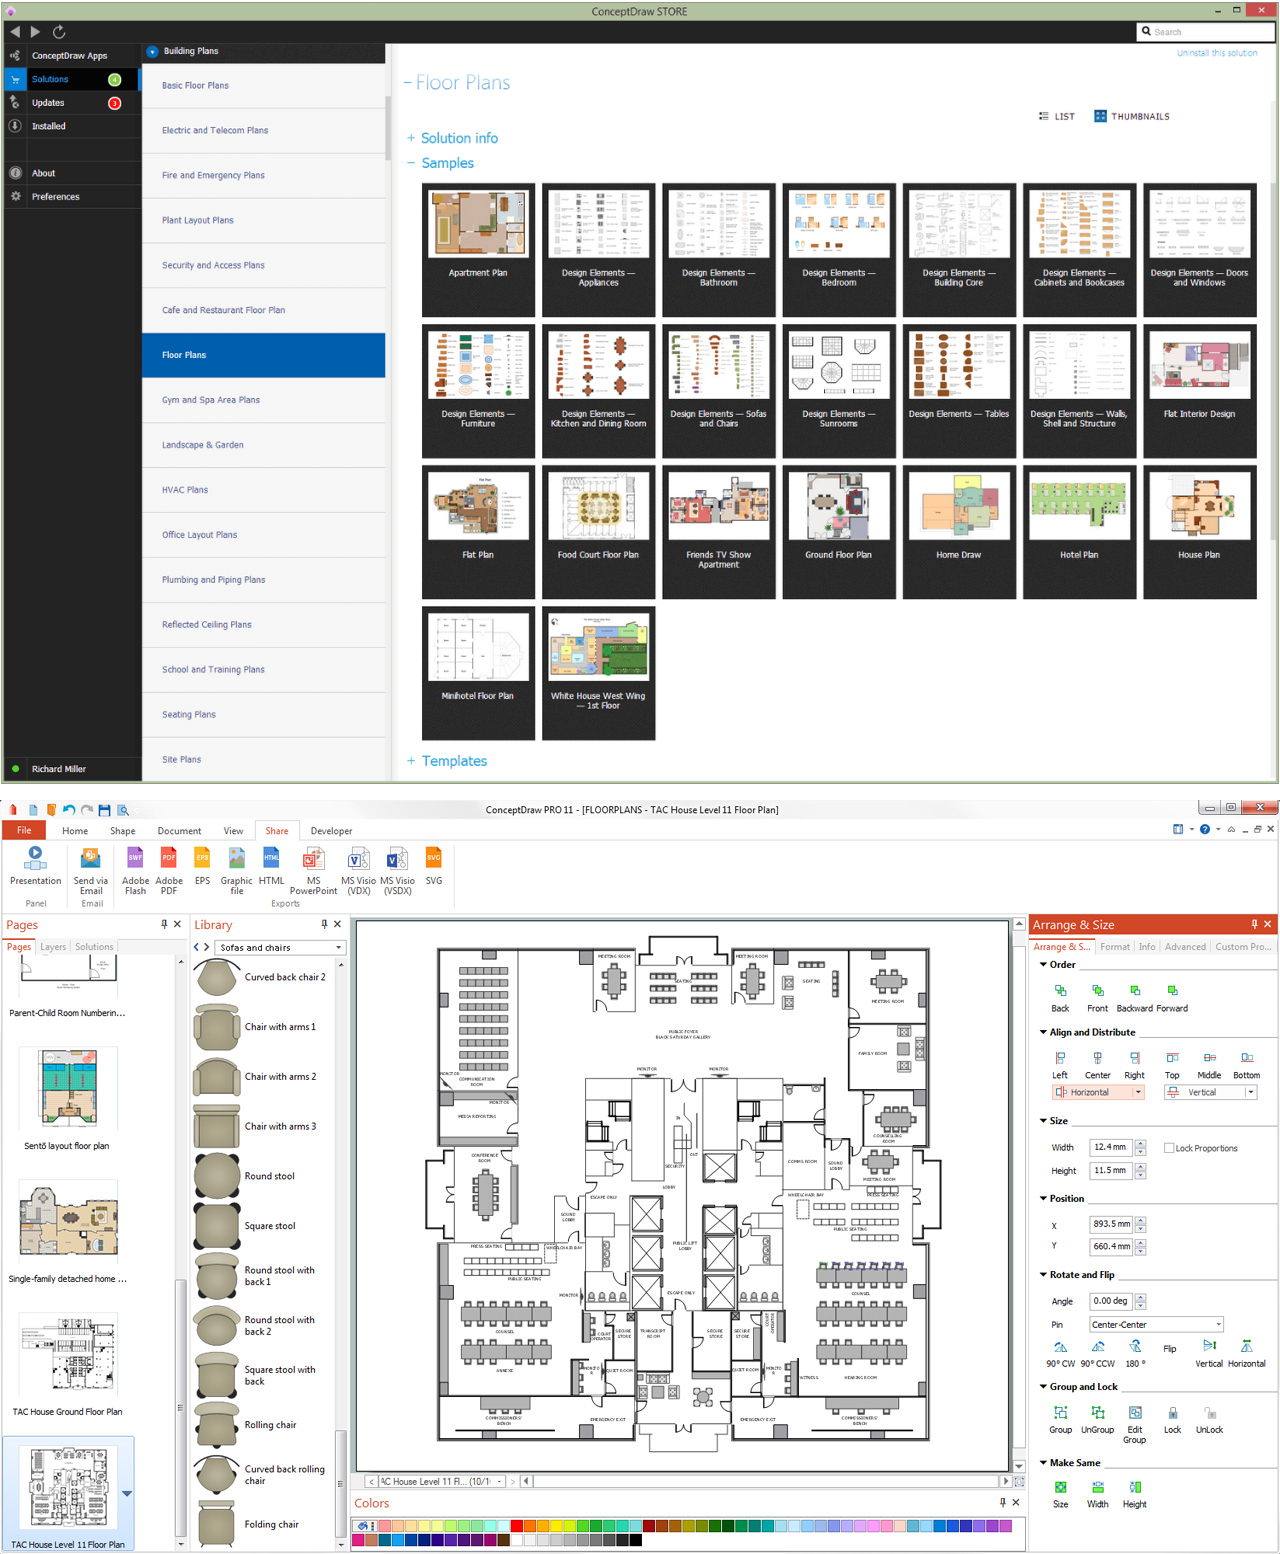
The blueprints are the set of drawings used by architects and builders in the process of construction of the buildings. The blueprints represent the top views on the buildings (homes, offices, etc.). They are drawn in the scale and use the special blueprint symbols and blueprints codes. Earlier the blueprints wer printed on the special paper and was blue. It's very easy, quick and convenient to draw the professional looking blueprints in ConceptDraw DIAGRAM diagramming and vector drawing software.Express-G Diagram
The vector stencils library from the solution Information Model Diagrams contains specific data type symbols of the EXPRESS-G notation such as entity data type symbols, simple data type symbols, enumeration data type symbols, defined data type symbols, select data type symbols and specific attribute symbols for ConceptDraw DIAGRAM diagramming and vector drawing software. The Information Model Diagrams solution is contained in the Software Development area of ConceptDraw Solution Park.
 Flowcharts
The Flowcharts solution for ConceptDraw DIAGRAM is a comprehensive set of examples and samples in several varied color themes for professionals that need to represent graphically a process. Solution value is added by the basic flow chart template and shapes' libraries of flowchart notation. ConceptDraw DIAGRAM flow chart creator lets one depict the processes of any complexity and length, as well as design the Flowchart either vertically or horizontally.
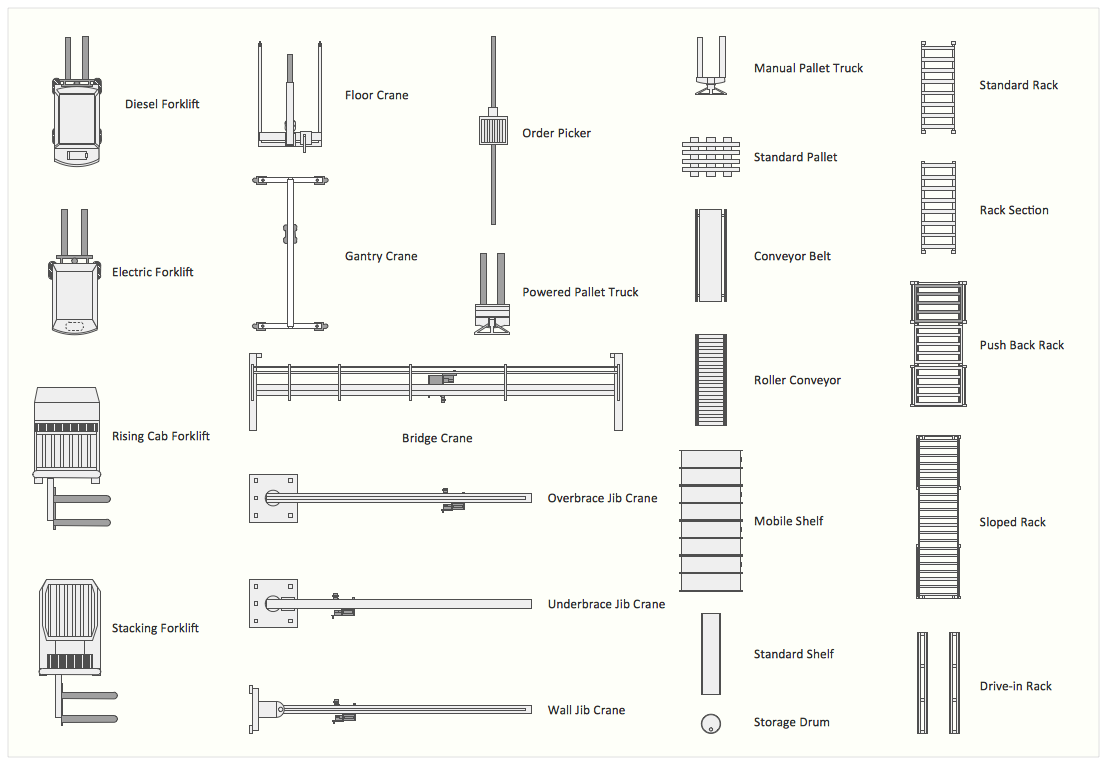
Interior Design. Storage and Distribution — Design Elements
Successful and comfy interior design has a great value for the premises of any kinds, for home, flats, offices, stores, and even for warehouses, industrial spaces, factories and plants. Development and professional representing of interior design projects is an interesting and exciting process, but quite difficult at the same time. Interior designer must clearly respect and take into account all wishes and requirements of the customer. But the use of special design software can greatly help in interior design. ConceptDraw DIAGRAM diagramming and vector drawing software extended with Plant Layout Plans solution includes the Storage and Distribution library with large quantity of vector design symbols and elements of storage and distribution industrial equipment, of forklifts, cranes, pallets, shelves, and racks of any kinds. They provide effective assistance in design various types of plant interior designs, plant interior design floor plans, industrial warehouse plans, storage and distribution industrial equipment layouts for the premises of any magnitude and destiny.
 Stakeholder Onion Diagrams
The Stakeholder Onion Diagram is often used as a way to view the relationships of stakeholders to a project goal. A basic Onion Diagram contains a rich information. It shows significance of stakeholders that will have has influence to the success achieve
Mechanical Design Software
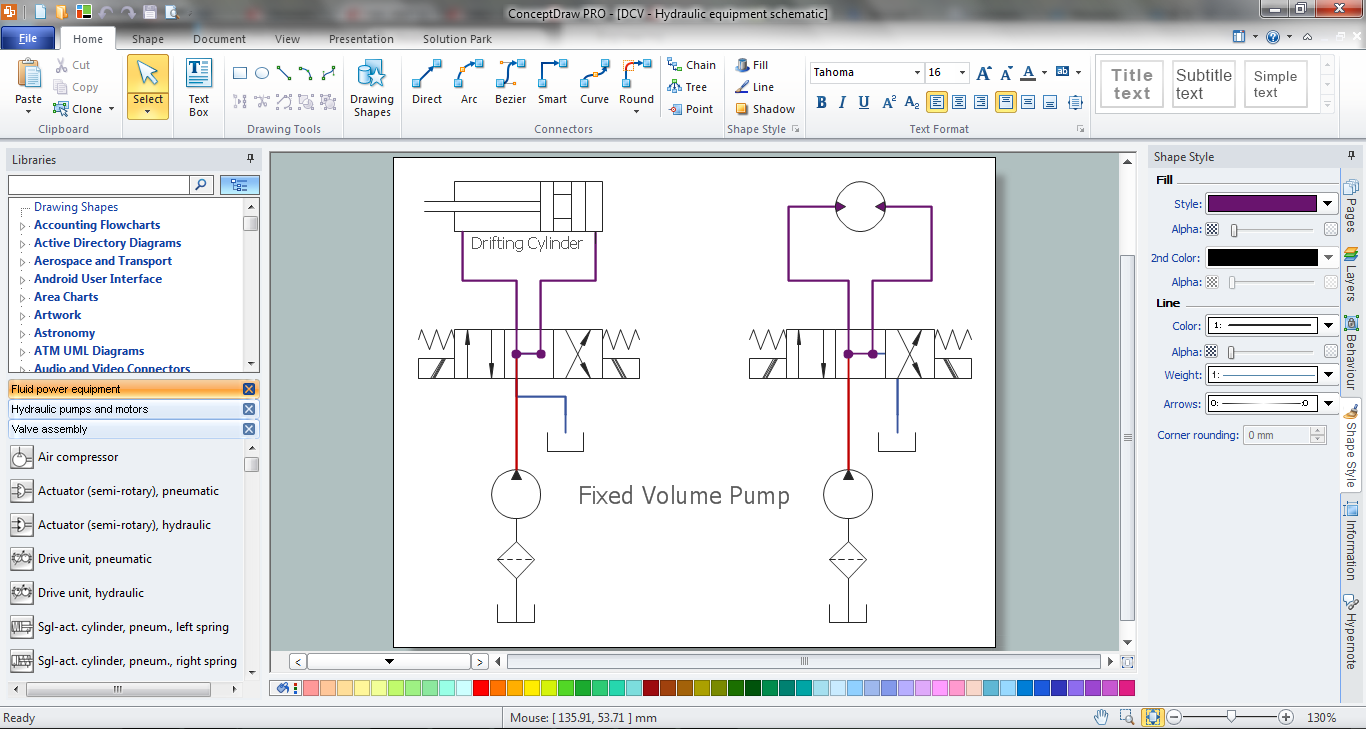
Mechanical design is a labour-intensive process. To facilitate the task of Mechanical Engineering Diagrams creating, ConceptDraw DIAGRAM diagramming and vector drawing software was extended with Mechanical Engineering solution from the Engineering area. Now, ConceptDraw DIAGRAM is a powerful Mechanical Design Software.
 Fishbone Diagrams
The Fishbone Diagrams solution extends ConceptDraw DIAGRAM software with the ability to easily draw the Fishbone Diagrams (Ishikawa Diagrams) to clearly see the cause and effect analysis and also problem solving. The vector graphic diagrams produced using this solution can be used in whitepapers, presentations, datasheets, posters, and published technical material.
- Offside (ice hockey) | Ice Hockey Offside Diagram | Soccer ( Football ...
- Soccer ( Football ) Positions | Basketball Illustrations | Soccer ...
- Soccer ( Football ) Positions | Basketball Court Diagram and ...
- Soccer ( Football ) Positions | Baseball Diagram – Basic Bunt ...
- Basketball Court Diagram and Basketball Positions | Soccer ...
- Basic Flowchart Symbols and Meaning | Soccer ( Football ...
- Business Tools Perceptual Mapping | BCG Matrix | Soccer ( Football ...
- Vertical association football pitch - Template | Soccer ( Football ...
- Soccer ( Football ) Dimensions | Soccer ( Football ) Diagram Software ...
- Soccer pictograms - Vector stencils library | Soccer pictograms ...


