This work flow chart sample was redesigned from the picture "Weather Forecast" from the article "Simulation Workflows".
[iaas.uni-stuttgart.de/ forschung/ projects/ simtech/ sim-workflows.php]
"(1) The weather is predicted for a particular geological area. Hence, the workflow is fed with a model of the geophysical environment of ground, air and water for a requested area.
(2) Over a specified period of time (e.g. 6 hours) several different variables are measured and observed. Ground stations, ships, airplanes, weather balloons, satellites and buoys measure the air pressure, air/ water temperature, wind velocity, air humidity, vertical temperature profiles, cloud velocity, rain fall, and more.
(3) This data needs to be collected from the different sources and stored for later access.
(4) The collected data is analyzed and transformed into a common format (e.g. Fahrenheit to Celsius scale). The normalized values are used to create the current state of the atmosphere.
(5) Then, a numerical weather forecast is made based on mathematical-physical models (e.g. GFS - Global Forecast System, UKMO - United Kingdom MOdel, GME - global model of Deutscher Wetterdienst). The environmental area needs to be discretized beforehand using grid cells. The physical parameters measured in Step 2 are exposed in 3D space as timely function. This leads to a system of partial differential equations reflecting the physical relations that is solved numerically.
(6) The results of the numerical models are complemented with a statistical interpretation (e.g. with MOS - Model-Output-Statistics). That means the forecast result of the numerical models is compared to statistical weather data. Known forecast failures are corrected.
(7) The numerical post-processing is done with DMO (Direct Model Output): the numerical results are interpolated for specific geological locations.
(8) Additionally, a statistical post-processing step removes failures of measuring devices (e.g. using KALMAN filters).
(9) The statistical interpretation and the numerical results are then observed and interpreted by meteorologists based on their subjective experiences.
(10) Finally, the weather forecast is visualized and presented to interested people." [iaas.uni-stuttgart.de/ forschung/ projects/ simtech/ sim-workflows.php]
The example "Workflow diagram - Weather forecast" was drawn using the ConceptDraw PRO diagramming and vector drawing software extended with the Workflow Diagrams solution from the Business Processes area of ConceptDraw Solution Park.
Work flow chart

 HVAC Plans
Use HVAC Plans solution to create professional, clear and vivid HVAC-systems design plans, which represent effectively your HVAC marketing plan ideas, develop plans for modern ventilation units, central air heaters, to display the refrigeration systems for automated buildings control, environmental control, and energy systems.
Network Diagram Software Physical Network Diagram


 Fishbone Diagram
Fishbone Diagrams solution extends ConceptDraw PRO software with templates, samples and library of vector stencils for drawing the Ishikawa diagrams for cause and effect analysis.
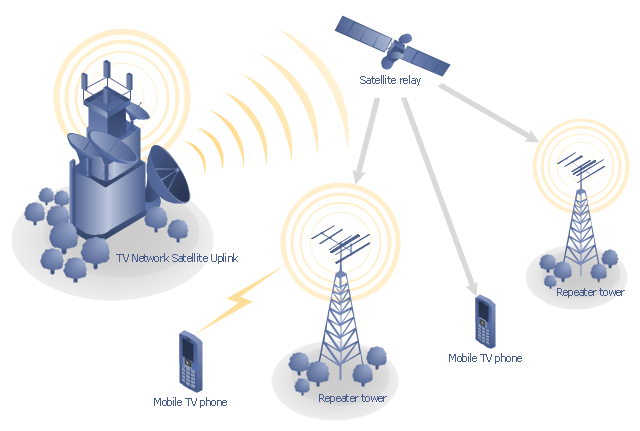
"Satellite television is television programming delivered by the means of communications satellite and received by an outdoor antenna, usually a parabolic reflector generally referred to as a satellite dish, and as far as household usage is concerned, a satellite receiver either in the form of an external set-top box or a satellite tuner module built into a TV set. Satellite TV tuners are also available as a card or a USB peripheral to be attached to a personal computer. In many areas of the world satellite television provides a wide range of channels and services, often to areas that are not serviced by terrestrial or cable providers.
Direct-broadcast satellite television comes to the general public in two distinct flavors - analog and digital. This necessitates either having an analog satellite receiver or a digital satellite receiver. Analog satellite television is being replaced by digital satellite television and the latter is becoming available in a better quality known as high-definition television." [Satellite television. Wikipedia]
"Mobile television is television watched on a small handheld or mobile device. It includes pay TV service delivered via mobile phone networks or received free-to-air via terrestrial television stations. Regular broadcast standards or special mobile TV transmission formats can be used. Additional features include downloading TV programs and podcasts from the internet and the ability to store programming for later viewing. ...
Mobile TV is among the features provided by many 3G phones." [Mobile television. Wikipedia]
"MobiTV, Inc. ... is a provider of end-to-end mobile media solutions. In 2011, the cloud-based MobiTV converged media platform delivered 1.6 billion minutes of live TV, video-on-demand and downloaded content for offline viewing to all tier-one wireless carriers and major mobile operating systems in the United States. ...
MobiTV furnishes programming from more than 40 television channels, offering live news and sports and a variety of full-episode on-demand shows for streaming or download on mobile devices, tablets, personal computers and other Internet-enabled consumer electronics.
MobiTV-powered TV services, which carry the operator’s brand, are accessible on hundreds of devices across multiple wireless carrier partners. ...
MobiTV’s converged media platform is an end-to-end managed service comprising components that work together to securely manage, deliver and play back video across devices both inside and outside the home." [MobiTV. Wikipedia]
This mobile satellite TV network diagram example was created using the ConceptDraw PRO diagramming and vector drawing software extended with the Telecommunication Network Diagrams solution from the Computer and Networks area of ConceptDraw Solution Park.
Mobile satellite TV diagram
"Consumption of energy resources, (e.g. turning on a light) requires resources and has an effect on the environment. Many electric power plants burn coal, oil or natural gas in order to generate electricity for energy needs. While burning these fossil fuels produces a readily available and instantaneous supply of electricity, it also generates air pollutants including carbon dioxide (CO2), sulfur dioxide and trioxide (SOx) and nitrogen oxides (NOx). Carbon dioxide is an important greenhouse gas which is thought to be responsible for some fraction of the rapid increase in global warming seen especially in the temperature records in the 20th century, as compared with tens of thousands of years worth of temperature records which can be read from ice cores taken in Arctic regions. Burning fossil fuels for electricity generation also releases trace metals such as beryllium, cadmium, chromium, copper, manganese, mercury, nickel, and silver into the environment, which also act as pollutants.
The large-scale use of renewable energy technologies would "greatly mitigate or eliminate a wide range of environmental and human health impacts of energy use". Renewable energy technologies include biofuels, solar heating and cooling, hydroelectric power, solar power, and wind power. Energy conservation and the efficient use of energy would also help." [Energy industry. Environmental impact. Wikipedia]
The Energy resources diagram example was created in the ConceptDraw PRO diagramming and vector drawing software using the Manufacturing and Maintenance solution from the Illustration area of ConceptDraw Solution Park.
Infographics

- Block diagram - Automotive HVAC system | Block Diagram For Air Car
- Www How To Draw Fishbone Diagram For Air Pollution
- Data Flow Diagram For Air Conditioner Production
- Air Conditioning System Block Diagram
- Air Pollution Fishbone Diagram
- Block Diagram Of Air Condition Control System
- HVAC Plans | Block diagram - Automotive HVAC system | How to ...
- Air Transport Diagram
- Workflow diagram - Weather forecast | Diagrams Of Means Of Air ...
- Pie Diagram Of Air
- Fishbone Diagram | HVAC Plans | Design elements - Aircraft ...
- Car Engine Block Diagram With Air Conditioning System
- Bar Diagram Showing Different Elements Of Air
- Block diagram - Automotive HVAC system | HVAC Marketing Plan ...
- Block Diagram Air Condition In Car
- Diagram Of Air In The Atmosphere
- Block Diagram Of Air System
- Fishbone Diagram | Workflow diagram - Weather forecast | HVAC ...
- HVAC Plans | Design elements - HVAC controls | Fishbone Diagram ...
- Block diagram - Automotive HVAC system | Automobile Air ...