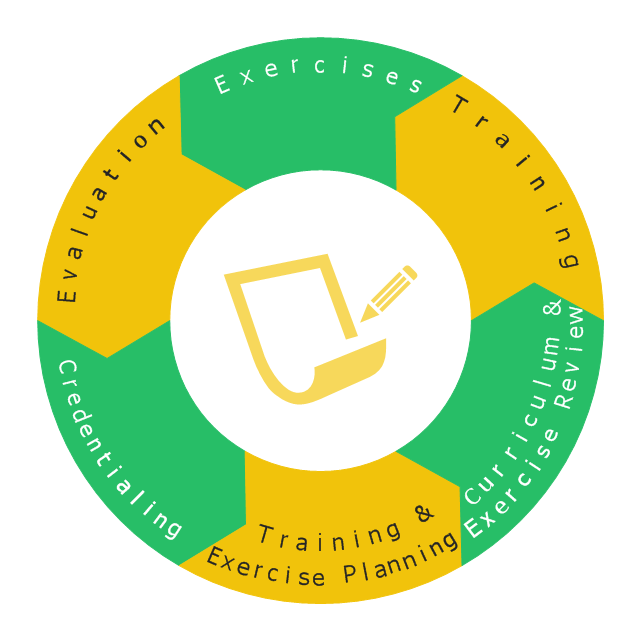
This wheel diagram sample illustrates the emergency preparedness training and exercise processes. It was designed on the base of the diagram on the webpage "Public Health Preparedness Training and Exercise" from the FloridaHealth website of the Florida Department of Health. [floridahealth.gov/ programs-and-services/ emergency-preparedness-and-response/ training-exercise/ ]
"Emergency Preparedness is the discipline of dealing with and avoiding both natural and manmade disasters. It involves mitigation, preparedness, response and recovery in order to lessen the impact of disasters. Emergency management requires a partnership among all levels of government (local, State, and Federal) and the private sector (business and industry, voluntary organizations, and the public). Successful preparedness requires detailed planning and cooperation among each sector." [Emergency Preparedness. Wikipedia]
The arrow donut chart example "Training and exercise process wheel" was created using the ConceptDraw PRO diagramming and vector drawing software extended with the Circular Arrows Diagrams solution from the area "What is a Diagram" of ConceptDraw Solution Park.
Circular arrows diagram
Used Solutions
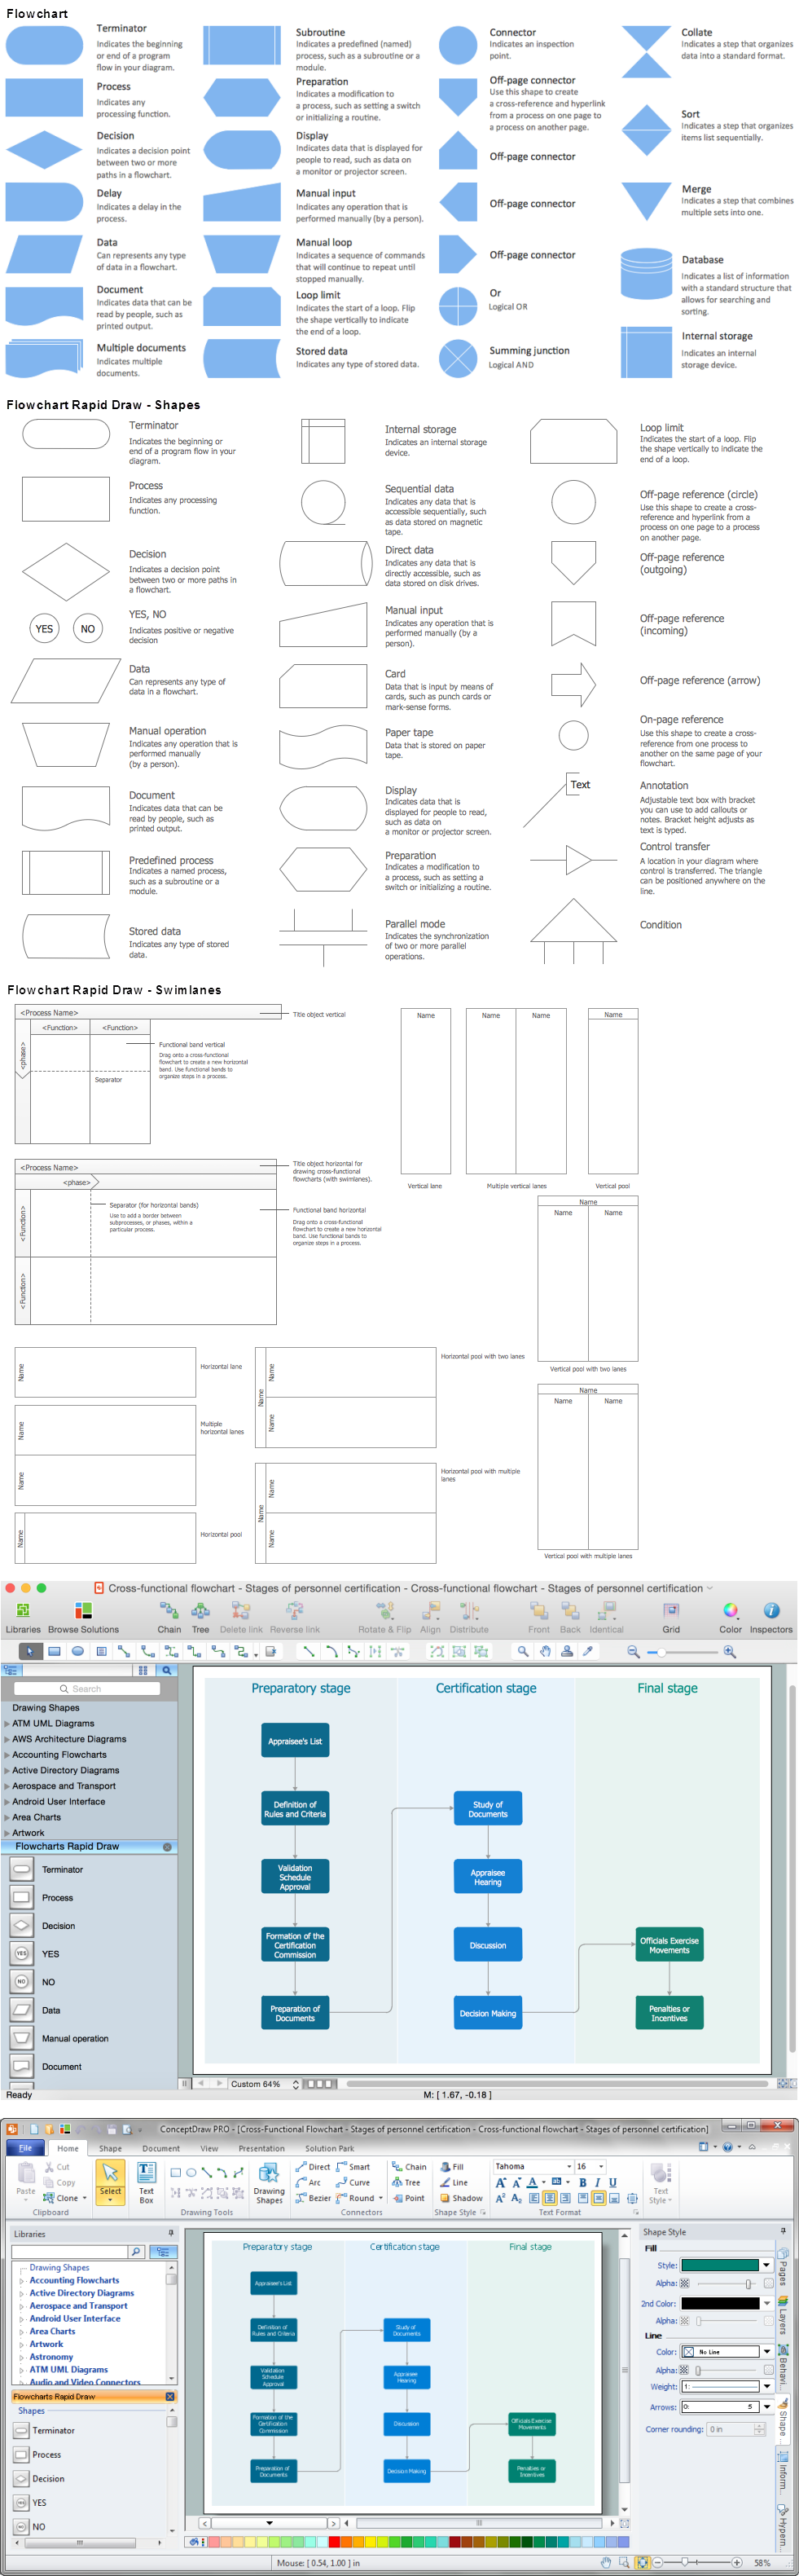
Technical Flow Chart

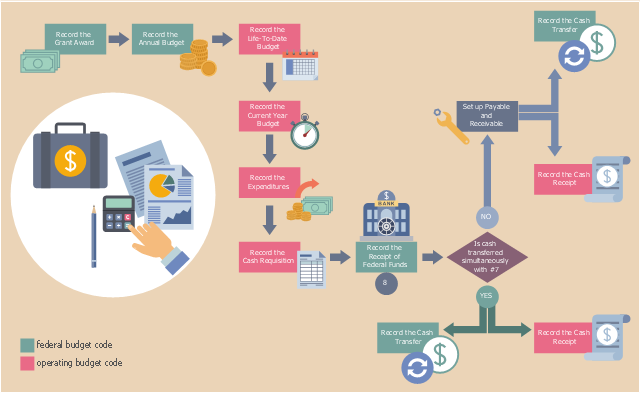
This example was designed on the base of the workflow diagram from the North Carolina Office of the State Controller website. [osc.nc.gov/ sigdocs/ sig_ docs/ documentation/ policies_ procedures/ flow.html]
"Grants are non-repayable funds or products disbursed by one party (grant makers), often a government department, corporation, foundation or trust, to a recipient, often (but not always) a nonprofit entity, educational institution, business or an individual. In order to receive a grant, some form of "Grant Writing" often referred to as either a proposal or an application is required. ...
Most grants are made to fund a specific project and require some level of compliance and reporting. The grant writing process involves an applicant submitting a proposal (or submission) to a potential funder, either on the applicant's own initiative or in response to a Request for Proposal from the funder. Other grants can be given to individuals, such as victims of natural disasters or individuals who seek to open a small business. Sometimes grant makers require grant seekers to have some form of tax-exempt status, be a registered nonprofit organization or a local government. ...
Project-related funding involving business, communities, and individuals is often arranged by application either in writing or online." [Grant (money). Wikipedia]
The workflow diagram example "Grant Accounting: business process flow" was created using ConceptDraw PRO software extended with the Business Process Workflow Diagrams solution from the Business Processes area of ConceptDraw Solution Park.
Workflow diagram
How to Discover Critical Path on a Gantt Chart

3 Circle Venn Diagram. Venn Diagram Example

Technical Flow Chart Example

Flow Diagram
Flow Diagrams

Process Flow Chart Symbol

Lean Six Sigma Diagram Software

- Pencil Entity Relationship Diagram
- Fax Machine Diagram In Pencil To Draw
- Water Cycle Pencil Diagram
- UML Flowchart Symbols | Pencil Project Sample Gui
- Pencil Sketch Diagram Of Balance Diet
- Pencil Project Examples
- Pencil Diagram Of Bus Topology
- Balance Diet Chart Pencil Drawing
- Training and exercise process wheel | Circular Arrows Diagrams ...
- Process Flowchart | Basic Flowchart Symbols and Meaning | Pencil ...