"Request methods.
An HTTP 1.1 request made using telnet. The request, response headers and response body are highlighted.
HTTP defines methods (sometimes referred to as verbs) to indicate the desired action to be performed on the identified resource. What this resource represents, whether pre-existing data or data that is generated dynamically, depends on the implementation of the server. Often, the resource corresponds to a file or the output of an executable residing on the server. The HTTP/ 1.0 specification:section 8 defined the GET, POST and HEAD methods and the HTTP/ 1.1 specification:section 9 added 5 new methods: OPTIONS, PUT, DELETE, TRACE and CONNECT. By being specified in these documents their semantics are well known and can be depended upon. Any client can use any method and the server can be configured to support any combination of methods. If a method is unknown to an intermediate it will be treated as an unsafe and non-idempotent method. There is no limit to the number of methods that can be defined and this allows for future methods to be specified without breaking existing infrastructure. For example, WebDAV defined 7 new methods and RFC5789 specified the PATCH method.
GET.
Requests a representation of the specified resource. Requests using GET should only retrieve data and should have no other effect. (This is also true of some other HTTP methods.)" [Hypertext Transfer Protocol. Wikipedia]
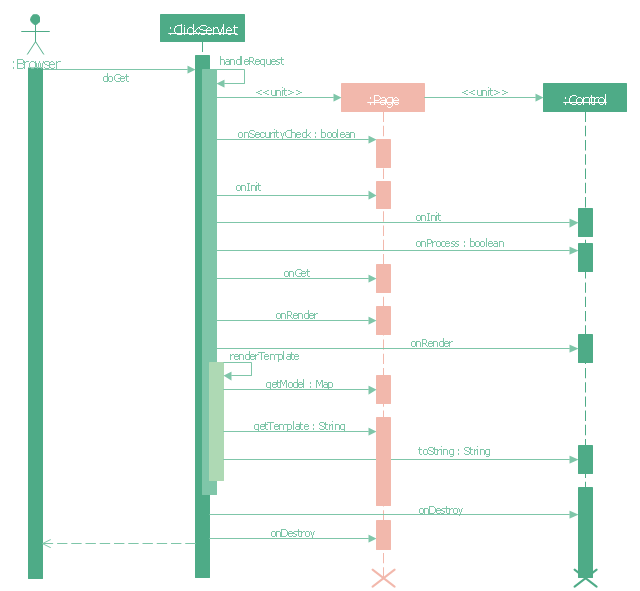
The UML sequence diagram example "GET request" was created using the ConceptDraw PRO diagramming and vector drawing software extended with the Rapid UML solution from the Software Development area of ConceptDraw Solution Park.
An HTTP 1.1 request made using telnet. The request, response headers and response body are highlighted.
HTTP defines methods (sometimes referred to as verbs) to indicate the desired action to be performed on the identified resource. What this resource represents, whether pre-existing data or data that is generated dynamically, depends on the implementation of the server. Often, the resource corresponds to a file or the output of an executable residing on the server. The HTTP/ 1.0 specification:section 8 defined the GET, POST and HEAD methods and the HTTP/ 1.1 specification:section 9 added 5 new methods: OPTIONS, PUT, DELETE, TRACE and CONNECT. By being specified in these documents their semantics are well known and can be depended upon. Any client can use any method and the server can be configured to support any combination of methods. If a method is unknown to an intermediate it will be treated as an unsafe and non-idempotent method. There is no limit to the number of methods that can be defined and this allows for future methods to be specified without breaking existing infrastructure. For example, WebDAV defined 7 new methods and RFC5789 specified the PATCH method.
GET.
Requests a representation of the specified resource. Requests using GET should only retrieve data and should have no other effect. (This is also true of some other HTTP methods.)" [Hypertext Transfer Protocol. Wikipedia]
The UML sequence diagram example "GET request" was created using the ConceptDraw PRO diagramming and vector drawing software extended with the Rapid UML solution from the Software Development area of ConceptDraw Solution Park.
UML sequence diagram
 Rapid UML
Rapid UML solution extends ConceptDraw PRO software with templates, samples and libraries of vector stencils for quick drawing the UML diagrams using Rapid Draw technology.
 Timeline Diagrams
Timeline Diagrams solution extends ConceptDraw PRO diagramming software with samples, templates and libraries of specially developed smart vector design elements of timeline bars, time intervals, milestones, events, today marker, legend, and many other elements with custom properties, helpful for professional drawing clear and intuitive Timeline Diagrams. Use it to design simple Timeline Diagrams and designate only the main project stages, or highly detailed Timeline Diagrams depicting all project tasks, subtasks, milestones, deadlines, responsible persons and other description information, ideal for applying in presentations, reports, education materials, and other documentation.
HelpDesk
How to Create a Functional Flow Block Diagram

HelpDesk
How to Add a Telecommunication Network Diagram to a PowerPoint Presentation Using ConceptDraw PRO

HelpDesk
How to Create a CCTV Diagram in ConceptDraw PRO

HelpDesk
How to Create a Cross - Functional Flowchart Using ConceptDraw PRO


 Fishbone Diagram
Fishbone Diagrams solution extends ConceptDraw PRO software with templates, samples and library of vector stencils for drawing the Ishikawa diagrams for cause and effect analysis.
- UML sequence diagram - GET request | Diagramming Software for ...
- UML sequence diagram - GET request | UML Sequence Diagram ...
- Booch OOD Diagram | UML Diagram | UML sequence diagram ...
- UML sequence diagram - GET request | Webdav Client Server ...
- UML sequence diagram - GET request | Target and Circular ...
- UML sequence diagram - GET request | Engineering | Management ...
- UML sequence diagram
- UML sequence diagram - GET request
- UML Diagram | UML sequence diagram - GET request | UML ...
- Sentence diagram - Compound predicate with one direct object ...
- Service Request Workflow Diagram
- Activity Network Diagram Method | UML activity diagram - Ticket ...
- How To Draw Sequence Diagram For Transport Request System
- Diagramming Software for designing UML Sequence Diagrams ...
- Server Change Request Template
- Activity Network Diagram Method | Pie Chart Examples and ...
- Class Diagram For Transport Request
- Request Flow Diagram Tool
- UML Sequence Diagram | Diagramming Software for designing ...
- Sequence Diagram Execution Occurrence