"Organizational behavior is a field of study that investigates the impact that individuals, groups and structures have on behavior within an organization for the purpose of applying such knowledge towards improving an organization's effectiveness. It is an interdisciplinary field that includes sociology, psychology, communication, and management; and it complements the academic studies of organizational theory (which is focused on organizational and intra-organizational topics) and human resource studies (which is more applied and business-oriented). It may also be referred to as organizational studies or organizational science." [Organizational behavior. Wikipedia]
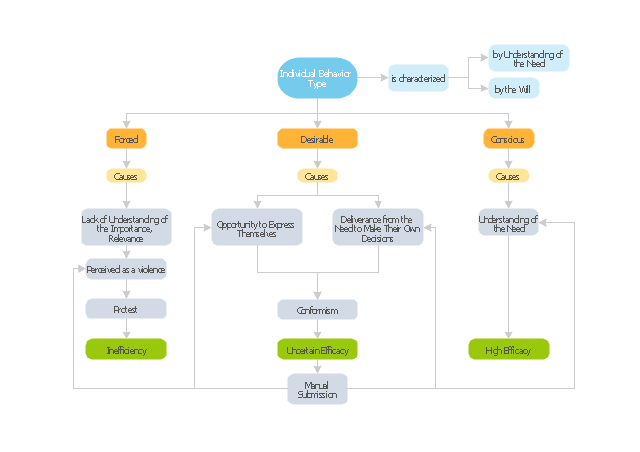
The block diagram example "Types of individual behavior in organization" was created using the ConceptDraw PRO diagramming and vector drawing software extended with the Block Diagrams solution from the area "What is a Diagram" of ConceptDraw Solution Park.
The block diagram example "Types of individual behavior in organization" was created using the ConceptDraw PRO diagramming and vector drawing software extended with the Block Diagrams solution from the area "What is a Diagram" of ConceptDraw Solution Park.
Block diagram
UML Block Diagram

UML Diagram Types List

Onion Diagram Process Design

How to Draw EPC Diagram Quickly
Diagram (Win, Mac)")

Stakeholder Onion Diagram Template

 SWOT and TOWS Matrix Diagrams
SWOT and TOWS Matrix Diagrams solution extends ConceptDraw PRO and ConceptDraw MINDMAP software with features, templates, samples and libraries of vector stencils for drawing SWOT and TOWS analysis matrices and mind maps.
Building Plan Software. Building Plan Examples

Conception d'organigramme Organigramme des symboles, formes, stencils et icônes

- Block diagram - Types of individual behavior in organization ...
- Block diagram - Types of individual behavior in organization | UML ...
- UML Diagram Types List | Organisational Behaviour Chart
- UML Diagram Types List | Organisational Behaviour Chart Diagram
- Flowchart Of Organisational Behaviour
- Process Flowchart | Pyramid Diagram | Organizational culture ...
- Chart Or Diagram Organisational Behaviour
- How to Draw an Organization Chart | Draw Company Structure with ...
- Block diagram - Types of individual behavior in organization | Block ...
- Basic Organisation Behaviour Block Model
- Block diagram - Types of individual behavior in organization | Basic ...
- Individual Behaviour In An Organisation Chart
- The Best Diagram Organizational Behaviour
- Various Structure In Organisational Behaviour With Diagrams
- Block diagram - Types of individual behavior in organization | Social ...
- Process Of Organisational Behaviour With Block Diagram
- Block diagram - Types of individual behavior in organization | UML ...
- UML Diagram Types List | Diagramm Of Organisational Behaviour
- With A Diagram Explain Organizational Behaviour
- Block diagram - Types of individual behavior in organization | Block ...