Best Value — Total Quality Management

Process Flowchart


Pie Chart Examples and Templates

Bar Diagrams for Problem Solving. Create manufacturing and economics bar charts with Bar Graphs Solution

TQM Software — Build Professional TQM Diagrams

Best Diagramming


 Circular Arrows Diagrams
Circular Arrows Diagrams solution extends ConceptDraw PRO v10 with extensive drawing tools, predesigned samples, Circular flow diagram template for quick start, and a library of ready circular arrow vector stencils for drawing Circular Arrow Diagrams, Segmented Cycle Diagrams, and Circular Flow Diagrams. The elements in this solution help managers, analysts, business advisers, marketing experts, scientists, lecturers, and other knowledge workers in their daily work.
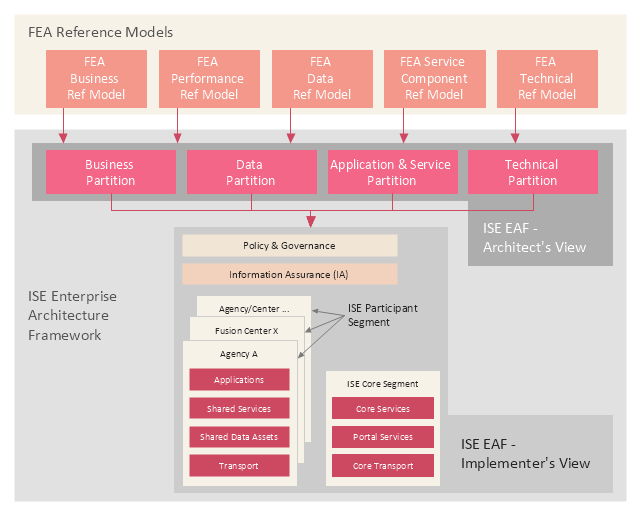
This enterprise architecture diagram example was drawn on the base of the figure illustrating the webpage "ISE Enterprise Architecture Framework 2007" from the Semantic Community website. "The ISE Enterprise Architecture Framework.
As Figure ... depicts, the Federal Enterprise Architecture (FEA) Reference Models (RMs) provide the basis for the ISE EAF. All elements of the ISE EAF are mapped back to elements of the FEA RMs with the FEA management processes applied by the OMB leveraged in support of implementing the ISE. The four ISE EAF partitions are mapped to the five FEA RMs to enable tracking the development of the ISE EAF across agencies using standardized OMB policies and processes that structure EA development and budgeting processes. The ISE EAF also provides an overarching mapping of the ISE into not only Federal civil systems, but also national security systems. ...
Two primary views are used to describe the ISE EAF: 1) the Architect’s View and 2) the Implementer’s View. While the term “view” is typically used to refer to different aspects of an architecture, the OMB suggested the term “partition” rather than the more common terms “architecture” or “view” to differentiate the ISE approach as a framework from the approach typically used in departmental and agency EAs. The Architect’s View comprises four partitions:
1) Business,
2) Data,
3) Application and Service, and
4) Technical.
The Architect’s View is used to provide structural alignment of the ISE architectural components into the FEA structure to ensure strategies, business processes, investments, data, systems, and technologies within the ISE are integrated and compatible with those across the Federal government."
[semanticommunity.info/ Information_ Sharing_ Environment/ ISE_ Enterprise_ Architecture_ Framework_ 2007#Figure_ ES-2._ The_ ISE_ Enterprise_ Architecture_ Framework_ Is_ Defined_ by_ Two_ Views_ and_ Four_ Partitions]
The diagram example "The ISE Enterprise Architecture Framework" was created using the ConceptDraw PRO diagramming and vector drawing software extended with the Enterprise Architecture Diagrams solution from the Management area of ConceptDraw Solution Park.
Enterprise architecture diagram
Circular Flow Diagram Template

Percentage Pie Chart. Pie Chart Examples

- Business Sector Diagram Sample
- Business Sectors Diagram Flow
- Business Sector Draw A Diagram Of Each Sector
- Flow Chart Diagram About The Business Sectors
- The Diagram Of The Business Sector And Its Examples
- Choose A Product To Draw A Diagram Of Business Sectors
- Business Report Pie. Pie Chart Examples | Example of ...
- The Business Sectors Diagram For A Business
- Diagrams That Explain Business Sectors
- What Can I Draw That Represents A Product Of Each Business Sector