This site uses cookies. By continuing to browse the ConceptDraw site you are agreeing to our Use of Site Cookies.

Example of DFD for Online Store (Data Flow Diagram)

Data Flow Diagram (DFD) is a methodology of graphical structural analysis and information systems design, which describes the sources external in respect to the system, recipients of data, logical functions, data flows and data stores that are accessed. DFDs allow to identify relationships between various system's components and are effectively used in business analysis and information systems analysis. They are useful for system’s high-level details modeling, to show how the input data are transformed to output results via the sequence of functional transformations. For description of DFD diagrams are uses two notations — Yourdon and Gane-Sarson, which differ in syntax. Online Store DFD example illustrates the Data Flow Diagram for online store, the interactions between Customers, Visitors, Sellers, depicts User databases and the flows of Website Information. ConceptDraw DIAGRAM enhanced with Data Flow Diagrams solution lets you to draw clear and simple example of DFD for Online Store using special libraries of predesigned DFD symbols.
Steps to Creating a Sales Process Flow Chart

Education Infographics

The Education Infographics are popular and effectively applied in the educational process. Now you don't need to be an artist to design colorful pictorial education infographics thanks to the unique drawing tools of Education Infographics Solution for ConceptDraw DIAGRAM diagramming and vector drawing software.

Flowchart Definition
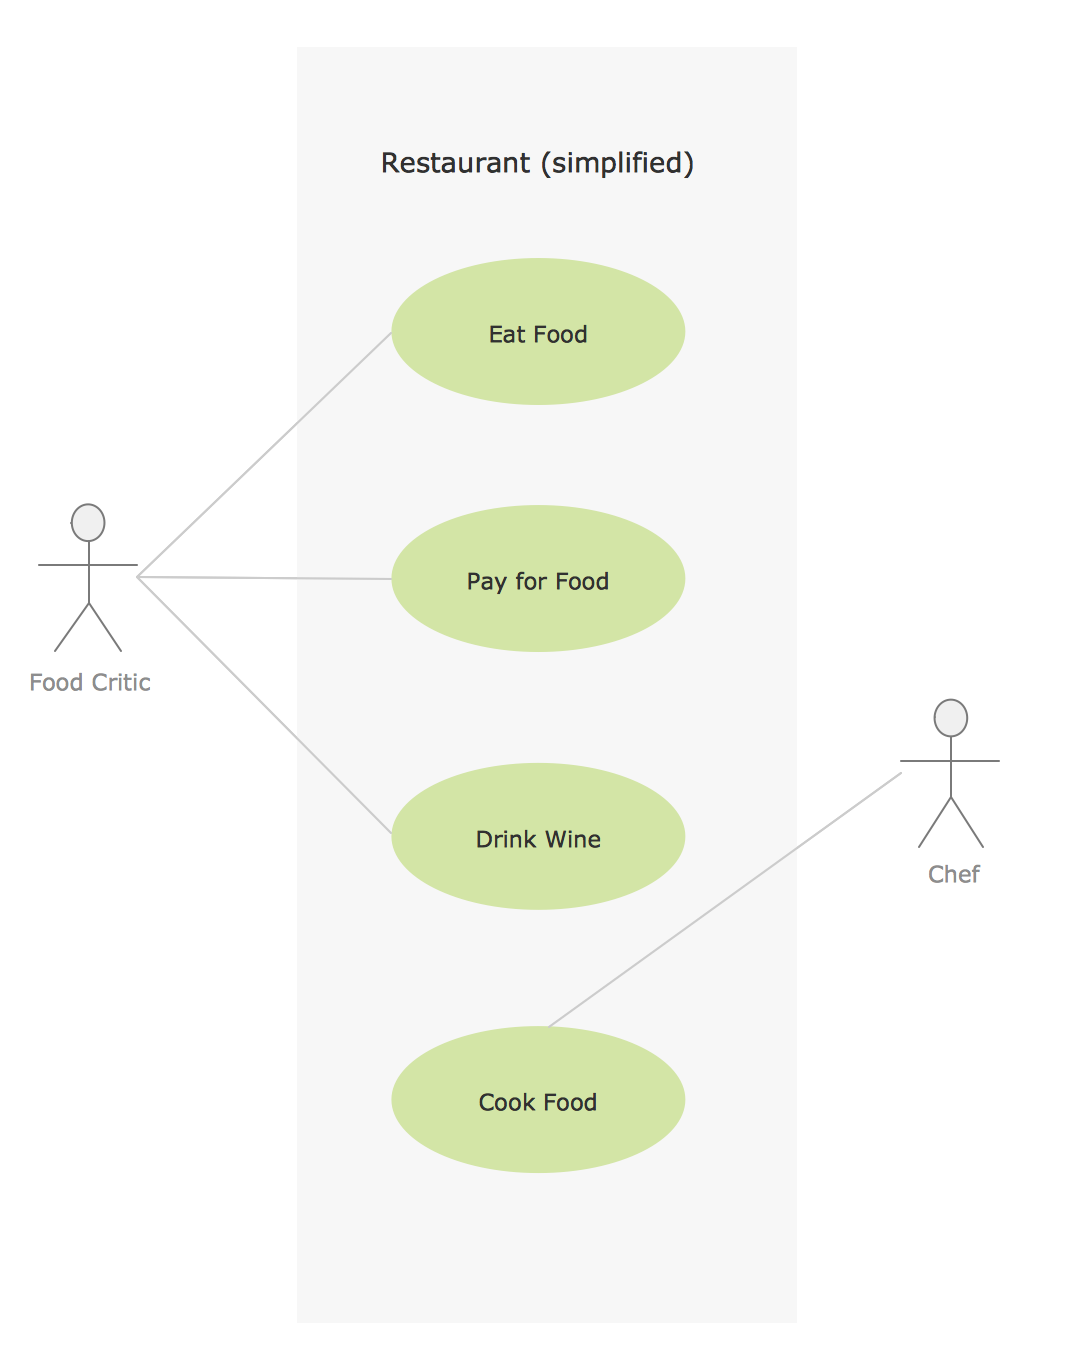
Flowchart definition - A Flowchart is a diagram that graphically represents the structure of the system, the flow of steps in a process, algorithm, or the sequence of steps and decisions for execution a process or solution a problem. For depiction the steps there are used specific shapes and graphic symbols which are linked by lines and directional arrows. The main standard shapes are rectangle or box, rounded box, diamond, circle. A Flowchart is a convenient way to observe the follow the process from beginning to end, it lets improve the work of process, highlight the key elements and detach not essential or even excessive steps. The Flowcharts can represent different levels of detail: High-Level Flowchart, Detailed Flowchart, and Deployment or Matrix Flowchart. They are incredibly useful for programmers when developing the programs of any complexity and on any high level language. Create your own Flowcharts using the ConceptDraw DIAGRAM diagramming and vector drawing software and powerful tools of Flowcharts solution from "Diagrams" area.

Sample for UML

This sample was created in ConceptDraw DIAGRAM diagramming and vector drawing software using the UML Use Case Diagram library of the Rapid UML Solution from the Software Development area of ConceptDraw Solution Park.

software engineering, data model, data modeling tools, orm Object-Role Modeling (ORM) Diagrams

software engineering, data model, data modeling tools, orm
Object-role Modeling (ORM) Diagram solution with powerful vector diagramming and data modeling tools, large quantity of specially developed samples and examples, and rich variety of vector objects corresponding to common ORM notation, ideally suits for developing the comprehensive, clear and visual Object-role Modeling (ORM) diagrams and schematics, understandable for all interested people from the different fields and business directions, for designing the ORM models, and demonstrating advantages from the use of ORM and its notation. It is intended for software developers and computer engineers, specialists in a field of Object-oriented programming (OOP), database architects, web-application constructors and developers, etc.

flow chart software, flowchart maker, flowchart, flow chart Flowcharts

flow chart software, flowchart maker, flowchart, flow chart
The Flowcharts solution for ConceptDraw DIAGRAM is a comprehensive set of examples and samples in several varied color themes for professionals that need to represent graphically a process. Solution value is added by the basic flow chart template and shapes' libraries of flowchart notation. ConceptDraw DIAGRAM flow chart creator lets one depict the processes of any complexity and length, as well as design the Flowchart either vertically or horizontally.

Create Sophisticated Professional Diagrams - Simply

ConceptDraw DIAGRAM is a powerful software that helps you create professional and easy drawing diagrams for business, technology, science and education.

marketing diagram, marketing chart Marketing Diagrams

marketing diagram, marketing chart
Marketing Diagrams solution extends ConceptDraw DIAGRAM diagramming software with abundance of samples, templates and vector design elements intended for easy graphical visualization and drawing different types of Marketing diagrams and graphs, including Branding Strategies Diagram, Five Forces Model Diagram, Decision Tree Diagram, Puzzle Diagram, Step Diagram, Process Chart, Strategy Map, Funnel Diagram, Value Chain Diagram, Ladder of Customer Loyalty Diagram, Leaky Bucket Diagram, Promotional Mix Diagram, Service-Goods Continuum Diagram, Six Markets Model Diagram, Sources of Customer Satisfaction Diagram, etc. Analyze effectively the marketing activity of your company and apply the optimal marketing methods with ConceptDraw DIAGRAM software.

food art, food pictures, pictures of food, food court, food images, fruit art, pictures of vegetables Food Court

food art, food pictures, pictures of food, food court, food images, fruit art, pictures of vegetables
Use the Food Court solution to create food art. Pictures of food can be designed using libraries of food images, fruit art and pictures of vegetables.

Diagram Software - The Best Choice for Diagramming

For vector shapes and connector tools for quick and easy drawing diagrams for business, technology, science and education - The best choice for Diagramming is ConceptDraw DIAGRAM.