"In elementary algebra, a quadratic equation (from the Latin quadratus for "square") is any equation having the form
ax^2+bx+c=0
where x represents an unknown, and a, b, and c are constants with a not equal to 0. If a = 0, then the equation is linear, not quadratic. The constants a, b, and c are called, respectively, the quadratic coefficient, the linear coefficient and the constant or free term.
Because the quadratic equation involves only one unknown, it is called "univariate". The quadratic equation only contains powers of x that are non-negative integers, and therefore it is a polynomial equation, and in particular it is a second degree polynomial equation since the greatest power is two.
Quadratic equations can be solved by a process known in American English as factoring and in other varieties of English as factorising, by completing the square, by using the quadratic formula, or by graphing." [Quadratic equation. Wikipedia]
The flowchart example "Solving quadratic equation algorithm" was created using the ConceptDraw PRO diagramming and vector drawing software extended with the Mathematics solution from the Science and Education area of ConceptDraw Solution Park.
Solving quadratic equation flow chart

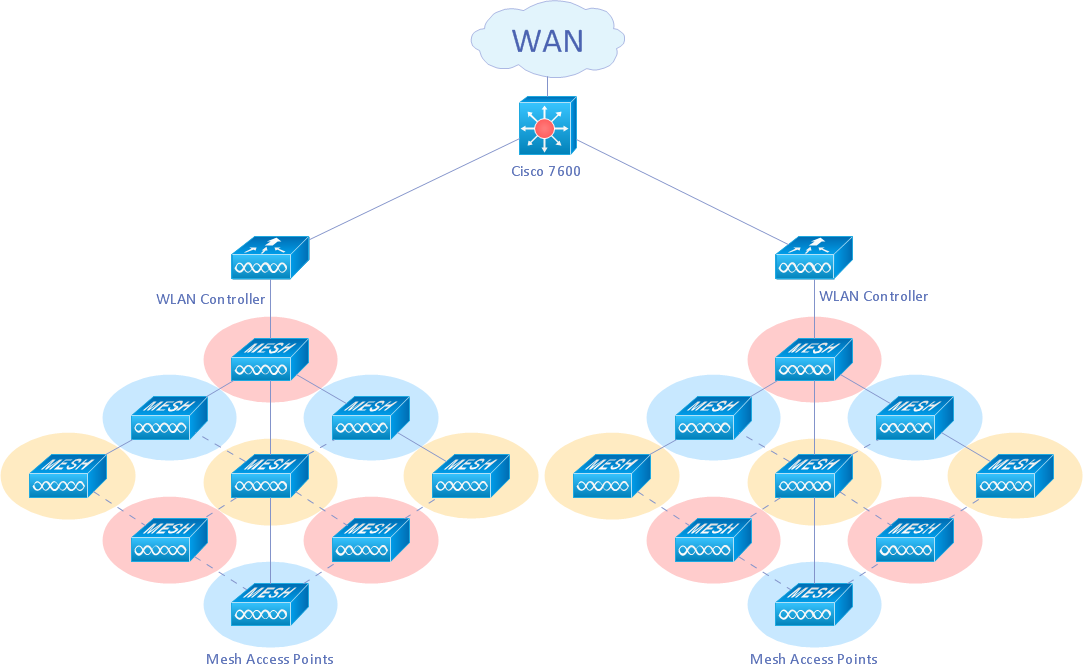
Wireless Network Drawing
Is ConceptDraw DIAGRAM an Alternative to Microsoft Visio?

Pyramid Diagram

Flowchart Examples and Templates

 Flowcharts
The Flowcharts solution for ConceptDraw DIAGRAM is a comprehensive set of examples and samples in several varied color themes for professionals that need to represent graphically a process. Solution value is added by the basic flow chart template and shapes' libraries of flowchart notation. ConceptDraw DIAGRAM flow chart creator lets one depict the processes of any complexity and length, as well as design the Flowchart either vertically or horizontally.
- Fault Tree Calculation Example
- Risk Assessment Decision Tree
- Calculate And Draw Custom Venn Diagrams
- Formula Of Finding Connection In Star Topology
- Calculating Pert
- Automatic Calculation Vector
- How To Calculate Pert Chart
- Venn Diagram Calculator 3 Sets
- Visio Calculate Area
- Decision Path Template Excel
- Activity on Node Network Diagramming Tool | Program Evaluation ...
- Activity on Node Network Diagramming Tool | Influence Diagram ...
- Risk Diagram (Process Decision Program Chart) | Risk Diagram ...
- Fault Tree Diagram | PROBLEM ANALYSIS. Root Cause Analysis ...
- Activity on Node Network Diagramming Tool | UML Deployment ...
- Decision Making | Block diagram - Customer decision making ...
- Entity Relationship Diagram Symbols | ERD Symbols and Meanings ...
- Diagramatic Representation Of Types Of Decisions
- Cross-Functional Flowchart | Activity on Node Network Diagramming ...